US inflation data, which is likely to affect the markets, is coming today. All eyes on the crypto and gold market will be on this data. So how will gold and Bitcoin react to the data?
Overview of US inflation data
The US inflation data, which investors are eagerly waiting for, will be announced today at 15.30 CEST. It’s possible that these data will determine the Federal Reserve’s next move. That’s why BTC and the broader market are focused on this data.
In case you missed it…
💸 US April #CPI Preview➡️ https://t.co/Aw5XEPlPVk
💰 #Gold Price Forecast➡️ https://t.co/RTeWGaQsTF
📈 #Bitcoin price likely to recover to $30,000➡️ https://t.co/K0ZpUkaah4#Forex #Crypto pic.twitter.com/mdbk7RVwq9
— FXStreet Team (@FXstreetUpdate) May 9, 2023
Expectations are that the US CPI, a closely watched report on the country’s inflation, remained high in April, consistent with March levels for consumer prices. Accordingly, markets expect last month’s CPI to increase by 5% compared to the previous year, in line with the annual increase recorded in March. It is estimated that there will be an increase of 0.4% in the monthly CPI, which is the normal CPI.

Regardless, even if the forecast is correct, the increase will remain above the Fed’s 2% target. This, in turn, has recently inspired efforts to raise interest rates to curb inflation. On May 3, the Federal Open Market Committee (FOMC) gave hints of a possible pause in increases. For this, the Fed cited its intention to evaluate the data that came before the June meeting.
There will be one more CPI release before the next FOMC meeting. It is worth noting that the June report will be announced one day before the Fed’s interest rate decision. However, it should be noted that the difference between actual and estimated CPI data will have a significant impact on the price of gold and Bitcoin rather than the data itself.
Implications for the crypto market
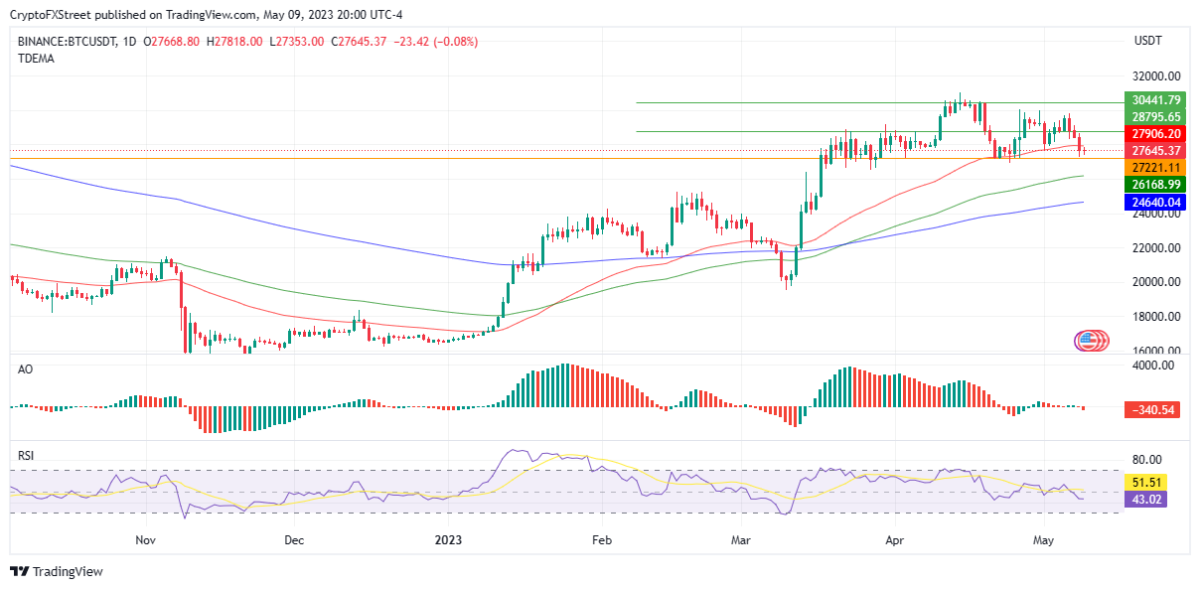
The rise of Bitcoin to the level of $ 30,000 will be put to the test with the release of US inflation data. Crypto analyst Lockridge Okoth assesses the impact on BTC’s technical outlook. Bulls are cautious but optimistic ahead of the data release as the Fed will determine the size of the next rate hike. BTC bears pushed Bitcoin price to a critical support level near $27.221. Now the leading crypto lacks direction trend and is moving sideways. Most likely the first reaction of market players will be a fake move before a correction. This explains why most successful traders do not trade on CPI days and wait for the market to settle.
According to the outlook, it is possible for Bitcoin to make a fake upside break. It is possible to potentially push above $30,441 before a pullback to continue the downtrend into the summer months when things tend to slow down. A higher-than-expected increase in monthly CPI will likely cause the Fed to reconsider its monetary stance. It will also lead to a US dollar buying spree across the board. This would be detrimental and therefore bearish for Bitcoin and crypto.
In the midst of a fairly stable macro backdrop over the past few weeks, some eyes will also be on the Binance exchange following their recent comments on Bitcoin network traffic. BTC seems to be stuck in a trading range. So, having a moment of hedging on Wall Street may be enough to send cryptos towards mid-March lows.
 BTC 1-Day Chart
Conversely, a lower-than-expected increase in the monthly CPI would see the market positioned for a dovish Fed policy change. Thus, it will put the crypto market under renewed buying pressure.
Investors will look for clues in US inflation data
cryptocoin.com As you can follow, gold started to rise yesterday ahead of the important US inflation data. Economists at ANZ Bank expect the yellow metal to hit an all-time high on a soft report. In this context, economists make the following assessment:
Investors are looking for any clues to the Fed’s interest rate trajectory. The precious metal has been hovering around $2,020, just below its all-time record high for several sessions. Any sign of easing consumer prices will indicate that this record is under threat.

Key levels for gold price
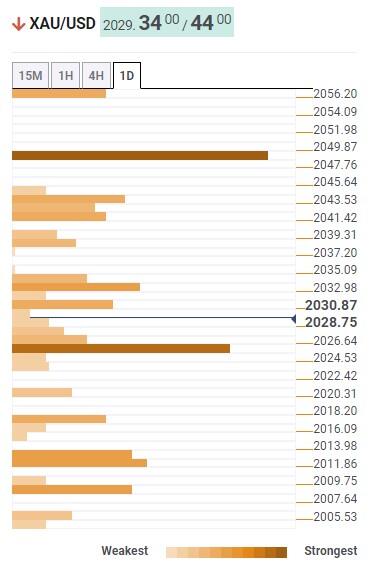
Technical analyst Anil Panchal identifies key levels for gold via Technical Confluence Detector. Gold price prints the first three-day loss, justifying its failure to pass the $2,050 barrier. However, the upper band of Bollinger on the daily chart joins the Pivot Point one-day R2 and the previous month’s high to indicate the aforementioned level as a key upside hurdle for gold.
It is worth noting that the recent pullback in gold prices should receive confirmation from the $2,025 support combination, including the one-month Fibonacci 23.6%, the one-day Fibonacci 61.8%, and the Bollinger lower band on the hourly chart. If the gold price dips below the key support of $2,025, a quick drop to the $2,010 level is possible, which consists of the monthly Fibonacci 38.2%, the one-day S2 Pivot Point, and the 10-DMA. Should it break this level, it will give way to challenge the $2,000 round figure.
Alternatively, the 5-DMA joins 23.6% of the Fibonacci one-day, maintaining the immediate upside around $2,035. Also, a break of this could push gold towards the $2,045 barrier, including one-month Pivot Point R1. Following this, the crucial combination of $2,050 resistance, including the Bollinger upper band one-day, Pivot Point R2 one-day and the previous month high, will be key for gold buyers. If gold exceeds $2,050, the ATH level of $2,080 will come to the fore.
 Technical Confluence Detector


