Gold price started the week with a decline. First, it broke below the three-week trading range. It then extended its decline to the lowest level in recent months at $1,910. Fears about the global economic slowdown are growing. Also, the hawkish outlook of major central banks continues. Combined, it is difficult for gold to initiate a decisive bullish move in the near term, according to market analyst Eren Şengezer.
A new bullish e for gold price in the near termtrend difficult!
The impressive November-May uptrend, with the price of gold rising from $1,620 to $2,080, was fueled by growing optimism about strong Chinese growth and major central banks’ retreat from aggressive policy tightening amid signs of softening inflation. During this period, the banking crisis in the USA provided an extra boost to gold prices. Gold reversed course as markets began to realize that inflation remained sticky in major economies and that the Fed’s rapid move contained threats to financial stability. Meanwhile, investors are beginning to pay attention to the potential impact of the subdued performance of major economies on gold’s demand outlook.
Next week’s macroeconomic events are unlikely to affect how markets see the big picture. Therefore, it is possible that the gold price will struggle to start a new bullish move in the near term. Also, recovery attempts are likely to be replaced by technical corrections.

There are data that will affect the gold price on Tuesday and Wednesday
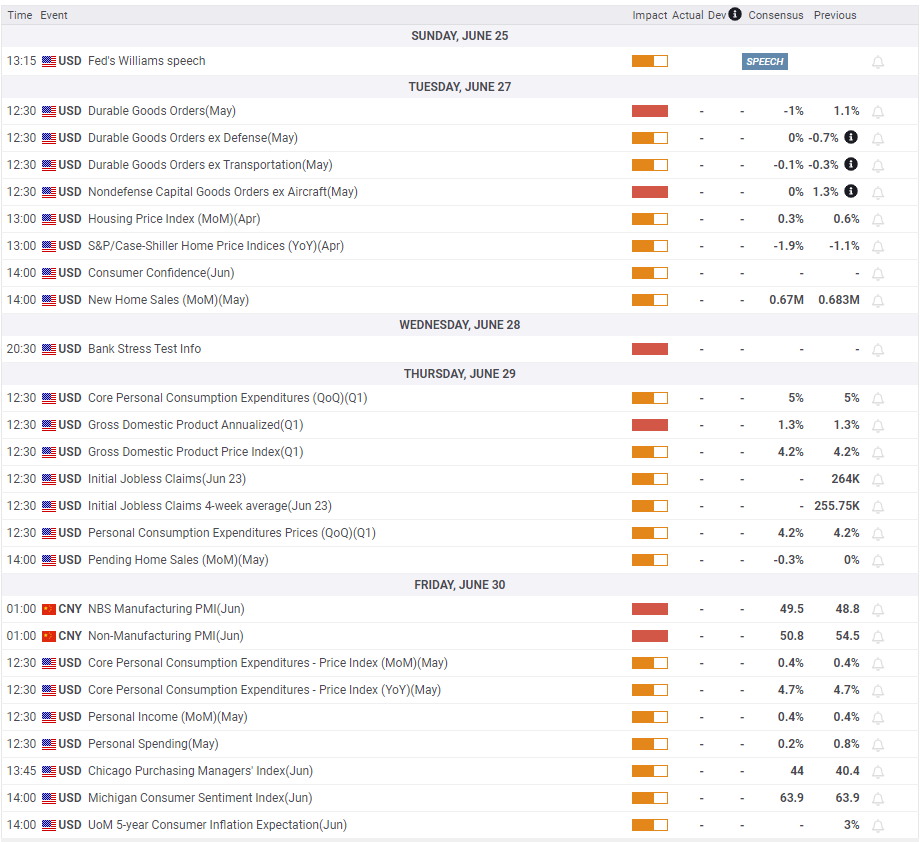
On Tuesday, May Durable Goods Orders and Conference Board’s June Consumer Confidence Index will be on the US economic agenda. cryptocoin.com On Wednesday, the Fed will announce the results of the Bank Stress Test. The analyst explains the impact of the data as follows:
If the data paints a bleak picture for the banking sector, market participants could begin to reassess the Fed’s rate outlook, causing the USD to weaken and gold to erase some of its recent losses. On the other hand, if medium and small-scale banks are confirmed to be in a healthy position after the financial crisis in March, the US dollar may strengthen with rising US yields and force gold to come under downward pressure.

What will be the impact of the US Core PCE on gold?
The US Bureau of Economic Analysis (BEA) will release its first quarter annualized GDP growth forecast on Thursday. Expectations are that it will match the previous estimate of 1.3%. On Friday, the BEA will release May Personal Consumption Spending (PCE) Price Index data, the Fed’s preferred gauge of inflation. Expectations are for Core PCE to increase by 0.4% on a monthly basis, in line with the increase in April. The analyst interprets the impact of the data on the gold price as follows:
Gold’s response to PCE inflation data will be simple. A monthly core data of 0.4% or higher is likely to put pressure on the gold price, while a data of 0.2% or lower could trigger a bullish move in the short term.
Gold price technical view
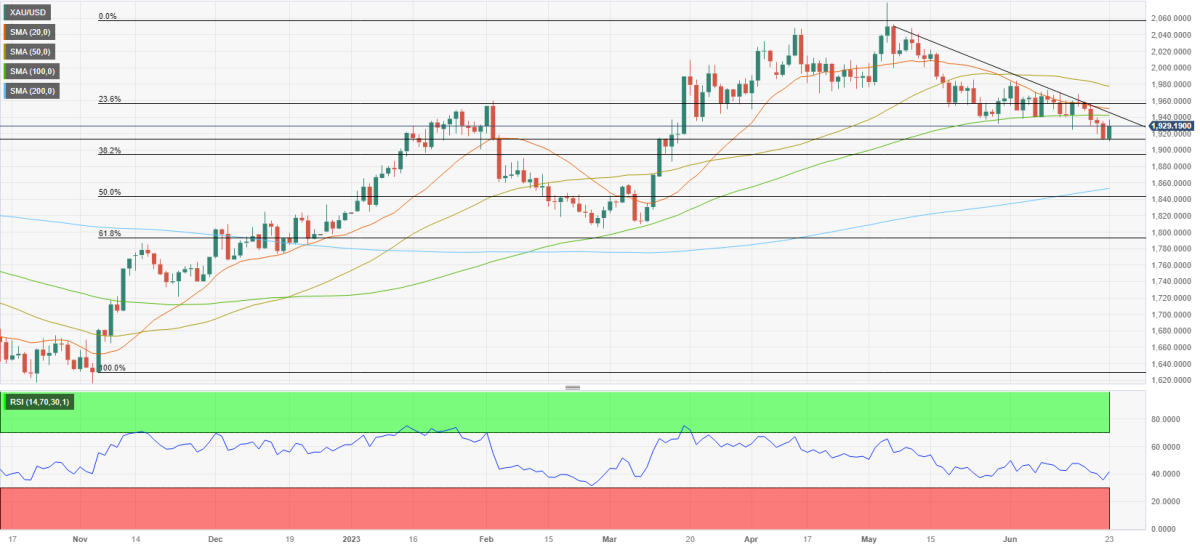
Market analyst Eren Şengezer also looks at the technical outlook for gold. Gold managed to stay above this level during the three-week consolidation phase. However, it later closed the last three days below the 100-day Simple Moving Average (SMA). Also, the Relative Strength Index (RSI) indicator on the daily chart has dropped to 40. Thus, it reflected the bearish trend in the short-term outlook.
On the downside, $1,910 (recent month low set on Thursday) holds intermediate support ahead of $1,900 (Fibonacci 38.2% retracement of recent uptrend, psychological level). Should the gold price drop below $1,900 and start using this level as resistance, the next bearish target could be set at $1,860 (200-day SMA).
Gold is likely to face stiff resistance at $1,940, where the descending trendline meets the 100-day SMA. A daily close above this level is likely to attract buyers. It could also open the door for an extended recovery towards $1,960 (Fibonacci 23.6% retracement, 20-day SMA) and $1,980 (50-day SMA).
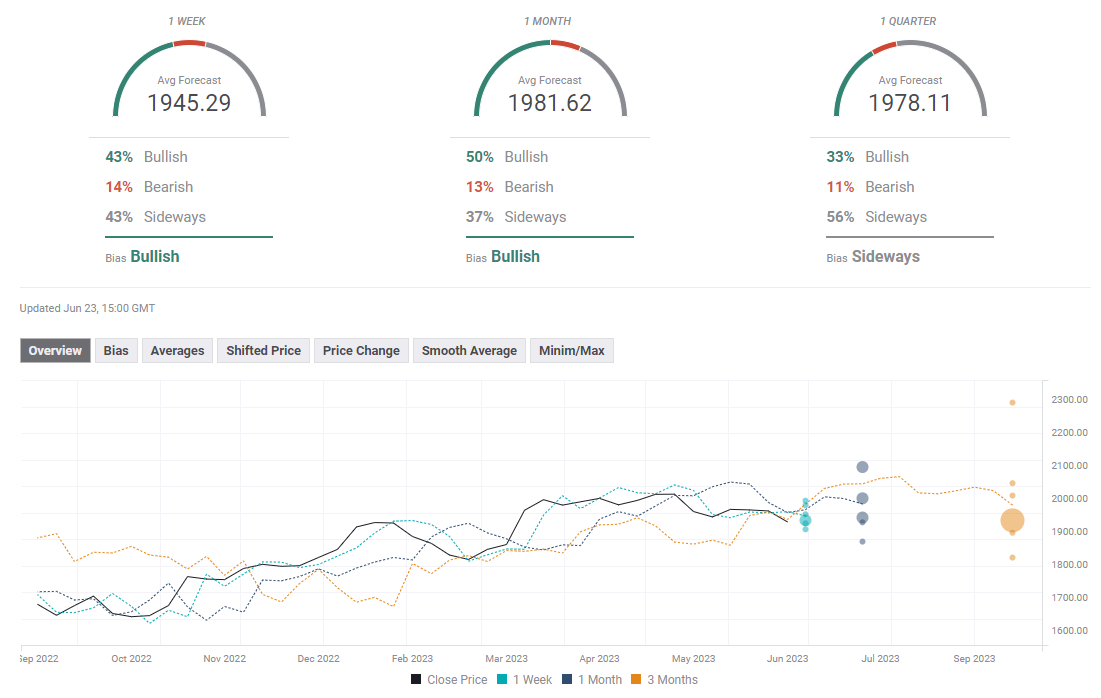
gold forecast survey
According to the FXStreet Forecast Survey, experts do not expect a rise in the near term. The survey shows that experts expect either a modest recovery or a sideways move in gold. The one-month outlook remains relatively bullish. However, the average target has now fallen to $1,981 from $1,998 the previous week.
