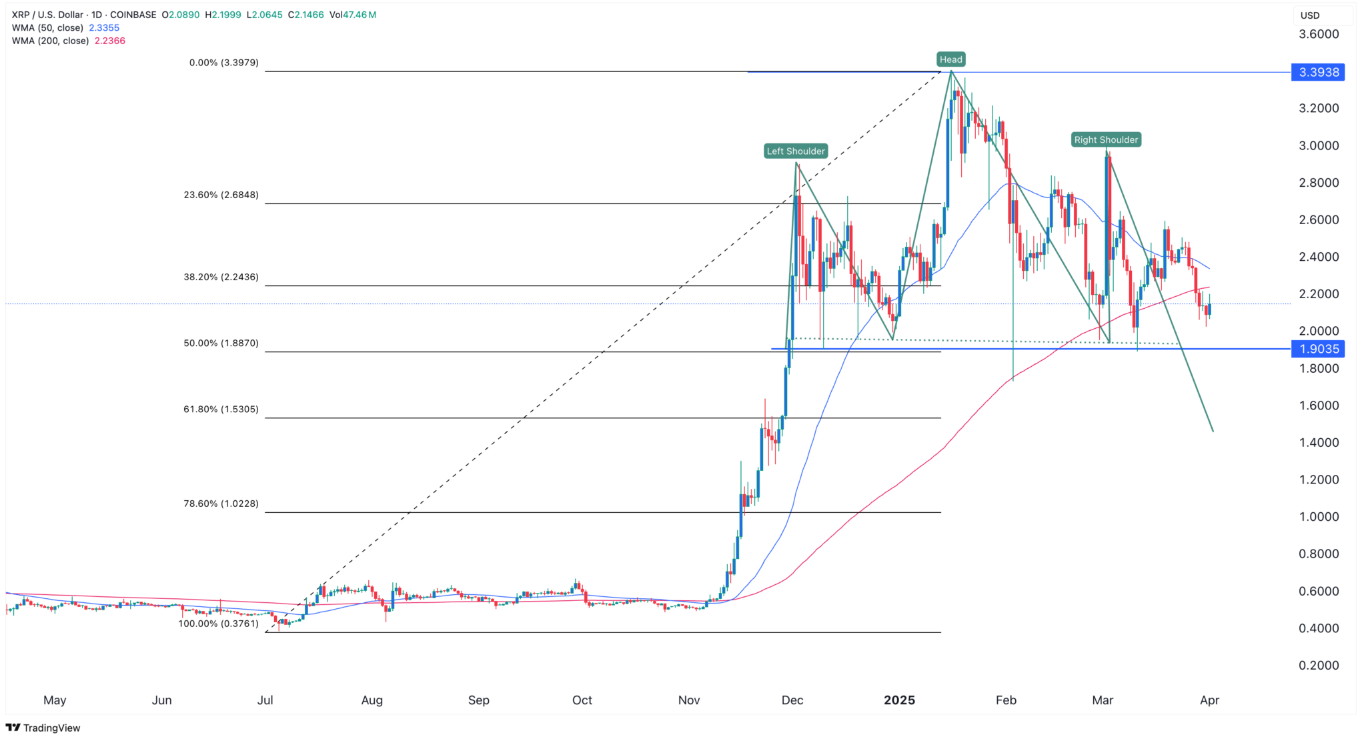
The XRP price experienced a serious decline despite the positive developments in the first quarter of the year. Despite the end of the SEC case, the rise of the Rlusd Stablecoin and the expansion in the Ripple ecosystem, the XRP fell 35 %of its summit in 2025 and fell to $ 2.20 as of April 1. Despite all these positive news, technical data and graphic structure show that the XRP is preparing for a harsh decline in the coming weeks.
Rlusd use is increasing but it is inadequate
Rusd, released by Ripple, aims to be an alternative to TETHER and USDC thanks to its regulation -compatible structure and transparency. According to the latest data, Rlusd’s market value is less than 0.1 %of the giant stablecoin market. However, there is a remarkable detail: Rlusd’s volume/total locked asset ratio (TVL) reached 37 %.
This shows that Rlusd is actively used and offers high liquidity. To compare, this rate is 14.26 %in USDC and 34.5 %in Tether. In other words, Rlusd has a much more efficient circulation. The XRP has become the largest actor on Ledger, and has also managed to prevent projects such as Sologiic, Coreum and XRP Army.

The basic data is strong, but why does the XRP price fall?
The Ripple team carries out active work to create a global payment network that will rival the SWIFT network. Moreover, positive developments such as the closure of the SEC case and the applications of Ripple Spot ETF have been experienced. However, the XRP price is far below expectations. One of the main reasons for this is that investors focus more on technical analysis data. The signals in the graphs show that they take control of bears, not bulls. In the short term, the technical structure gives serious danger signals.
XRP Technical View: Death cross and shoulder-head-danger
Death Cross, one of the most feared formations in the XRP price chart. The difference between the 50 -day -weighted moving average (WMA) and the 200 -day average narrows. This intersection is often a signal that triggers hard decreases.

In addition, the shoulder-head-formation of the graph indicates that the price may decrease. The neckline of this structure is $ 2.00. This level also corresponds to 50 %Fibonacci correction. If the XRP falls below this level, a withdrawal may be experienced up to $ 1.50.
Under what condition the rally returns?
If the XRP price increases over $ 3.00 to exceed the resistance of the right shoulder, all these decline scenarios may be invalid. In this case, the price can first target $ 3.40, the highest level of the year, and then the psychological threshold 5.00 dollars. However, this scenario needs a strong volume and corporate interest.


