
Bitcoin, SHIB and altcoins reflect their concerns about this week’s Jackson Hole symposium. Interest rate hikes and weakening bear market rally, which investors expect from the FED, also support the price decline. The Jackson Hole symposium is scheduled to take place on August 25.
Price predictions for SHIB, BTC and these 8 altcoins
Aggressive interest rate hike expectations in Europe and the USA turned the markets red. Also, investors are concerned that Fed chairman Jerome Powell detailed his plans for future rate hikes at the symposium. This macro uncertainty is keeping institutional investors away from the crypto markets. Crypto investment products recorded weekly volume of $1 billion, which is 55% lower than the annual average.
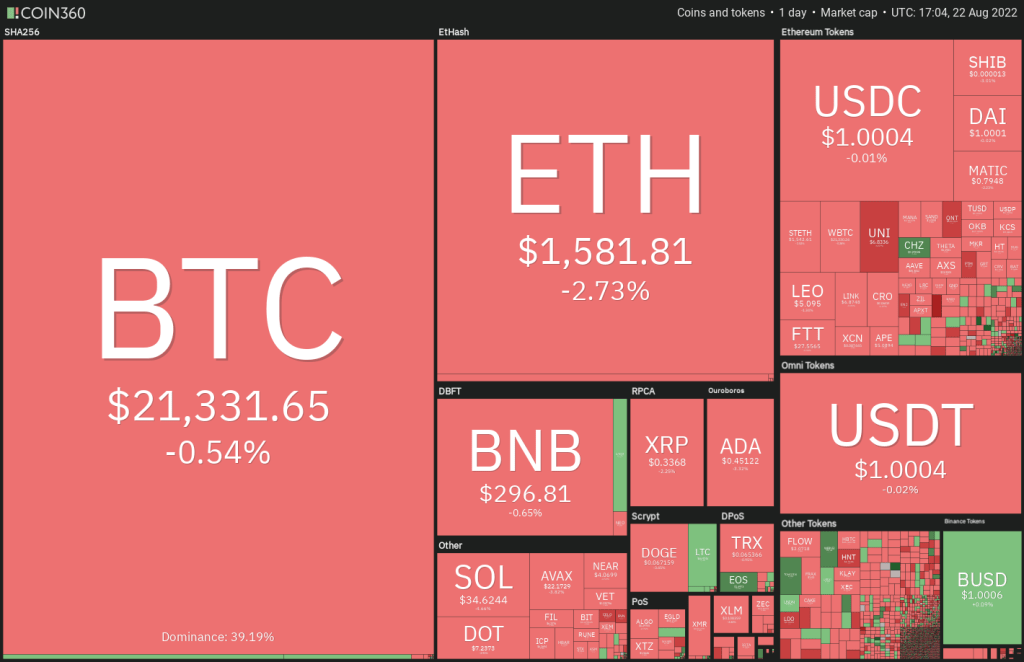
On-chain analytics resource Material Indicators said that Bitcoin has not dropped below its July lows. This shows that the bear market rally is not over yet. However, buyers must push the price above the 200-week moving average to gain the upper hand. This level is currently above $23,000. So what levels are expected for BTC, SHIB and altcoins? cryptocoin.comWe have compiled it for you.
Bitcoin (BTC)
Buyers defended the support line of the ascending channel on August 19 and started a bounce. However, the recovery stopped at $21,800. This shows that the bears pose a strong challenge near the moving averages. According to the long tail on the August 22 candlestick, the bulls are vigorously trying to defend the support line. Accordingly, it is possible for the bulls to push the price above $21,800. If this happens, BTC price is likely to rise to the 20-day EMA ($22,725).
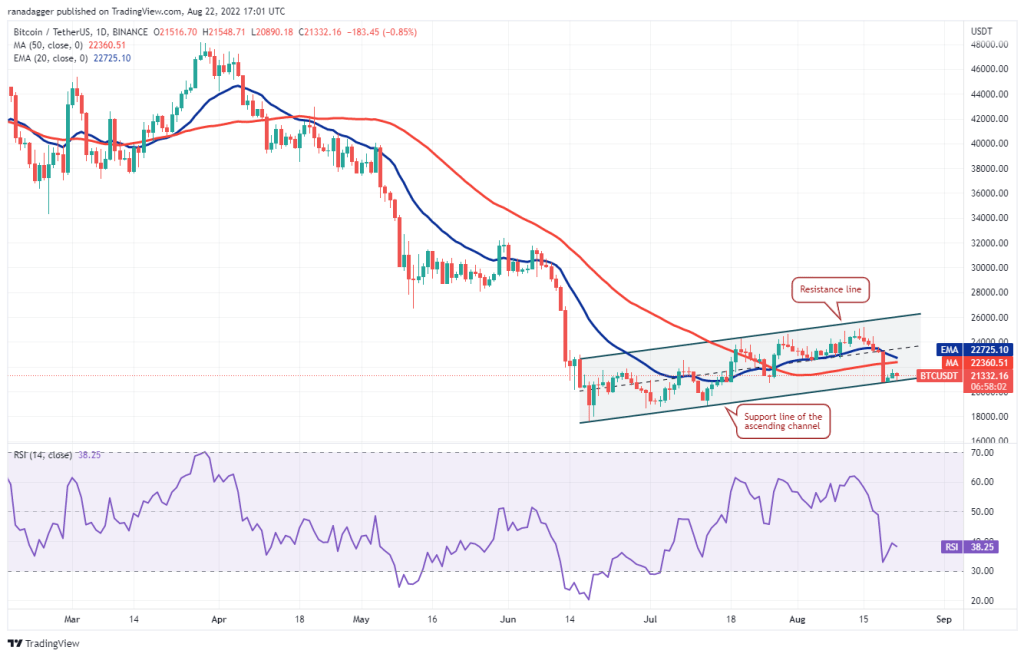
If BTC breaks down from this resistance, it will indicate that sentiment has turned negative. This will increase the likelihood of a breakout below the channel. If this also happens, selling momentum will increase and the pair will drop towards the June 18 low of $17,622. However, buyers will suggest that if Bitcoin moves above the 20-day EMA, the pair may extend its stay within the channel for a few more days. Thus, the bulls will try to push the price towards the resistance line of the channel.
Ethereum (ETH)
Ethereum (ETH) settled below the 20-day EMA ($1,718) and the $1,700 breakout level. Therefore, the altcoin shows that traders buying at lower levels are exiting their positions. The bulls tried to stop the decline at the 50-day SMA ($1,549). However, Ethereum’s weak bounce indicates a lack of aggressive buying at the level. As a result, the probability of a break below the support increases.
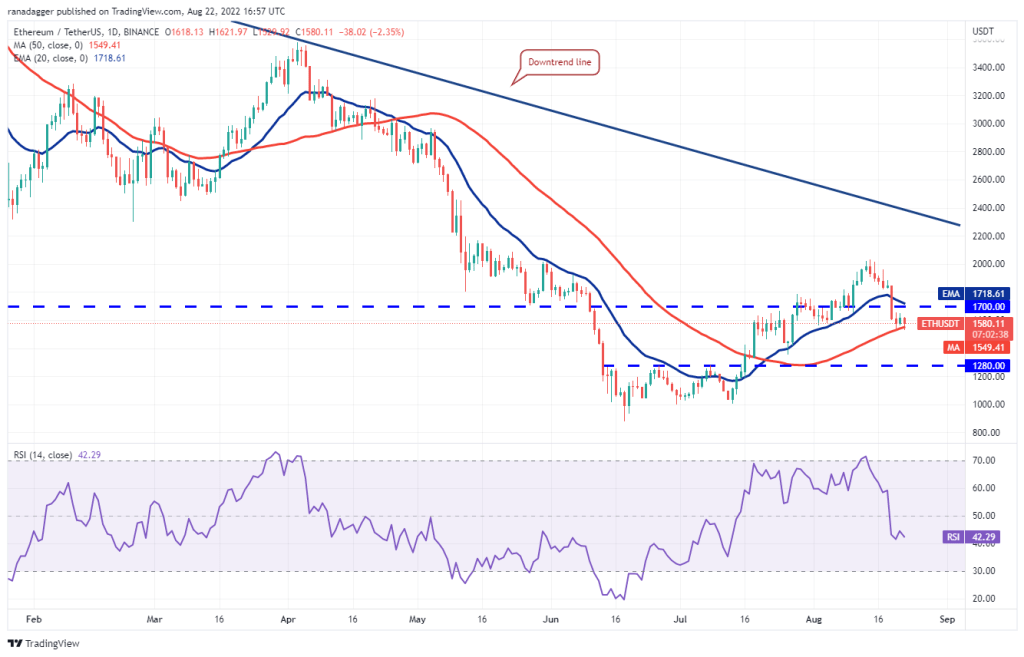
If this happens and Ethereum drops below $1,500, the bulls will wait for the price to reach the next strong support before buying again. ETH could therefore decline to $1,280. However, it is also possible for the price to bounce off the current level and break above the 20-day EMA. If this happens, traders who do not buy at the 50-day SMA will buy aggressively. These purchases carry the power to push the price towards $2,000.
Binance Coin (BNB)
It is facing stiff resistance at the 20-day EMA ($301) as Binance Coin (BNB) bounces off strong support at $275. But there is also a small positivity. This is because the bulls have left no floor to the sellers. This indicates that buyers expect the recovery to continue further. If BNB rises above the 20-day EMA, the price will rise to the overhead resistance at $338.
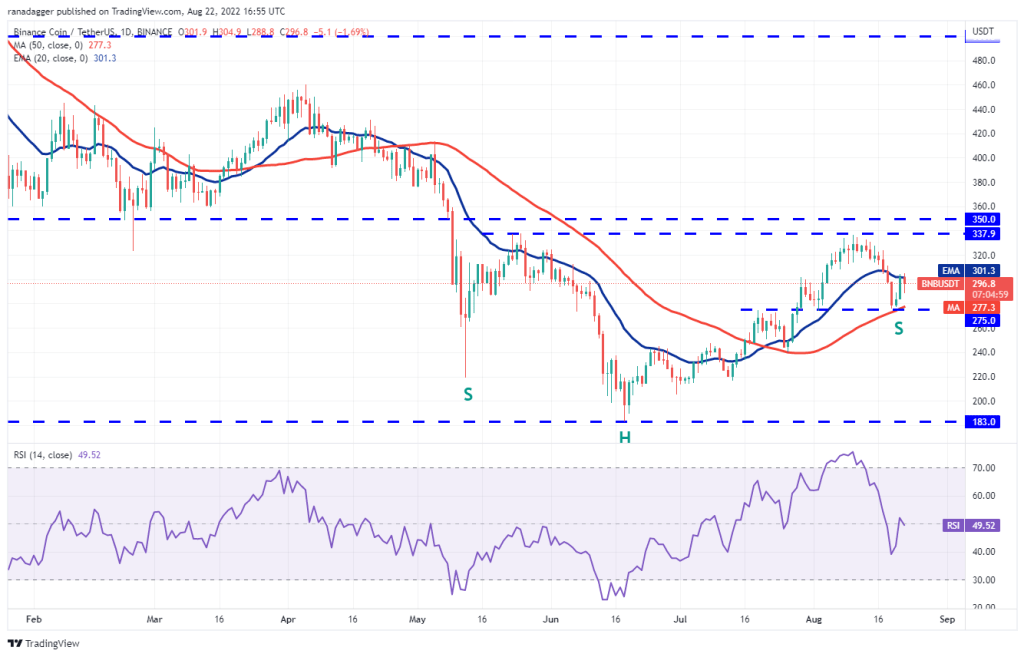
This is an important level to consider. Because a break and close above this will complete an uptrend over the head and shoulders. This setup has a model target of $493. However, the rise will be invalidated if the price drops below $275. At this point, the altcoin will target a drop to $212.
Ripple (XRP)
Ripple (XRP) is stuck in the $0.30 to $0.39 range. The bulls are trying to defend the support at $0.33. But they face stiff resistance at higher levels. If XRP dips below $0.33, the probability of a drop to $0.30 will increase. This level has previously acted as a strong support. Therefore, traders can buy the dip, waiting for a rally back to $0.39.
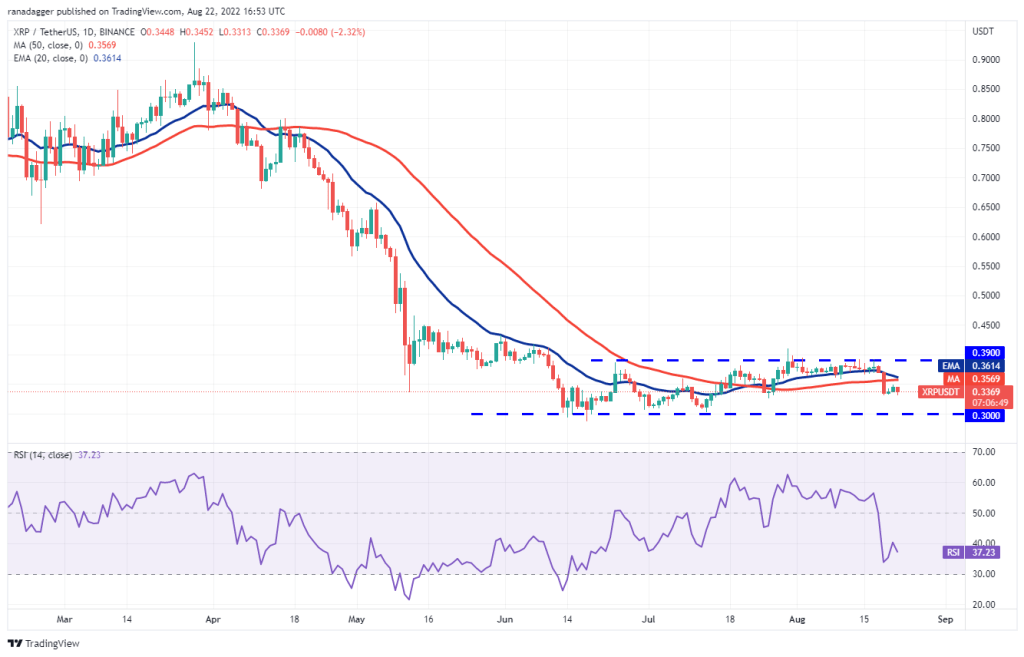
Another possibility is for the price to bounce off $0.33 and rise above the moving averages. If this happens, Ripple will rally towards the stiff overhead resistance at $0.39. It is difficult to predict the direction of a breakout from a range. Therefore, traders can wait for the breakout to occur before creating new positions.
Cardano (ADA)
Cardano (ADA) broke below the 50-day SMA ($0.49) on August 19. Thus, he showed that bears have the upper hand. Buyers tried to start a charity rally on August 20. But the weak bounce indicates a lack of demand at higher levels. The bears will now attempt to lower ADA to the strong support at $0.40.
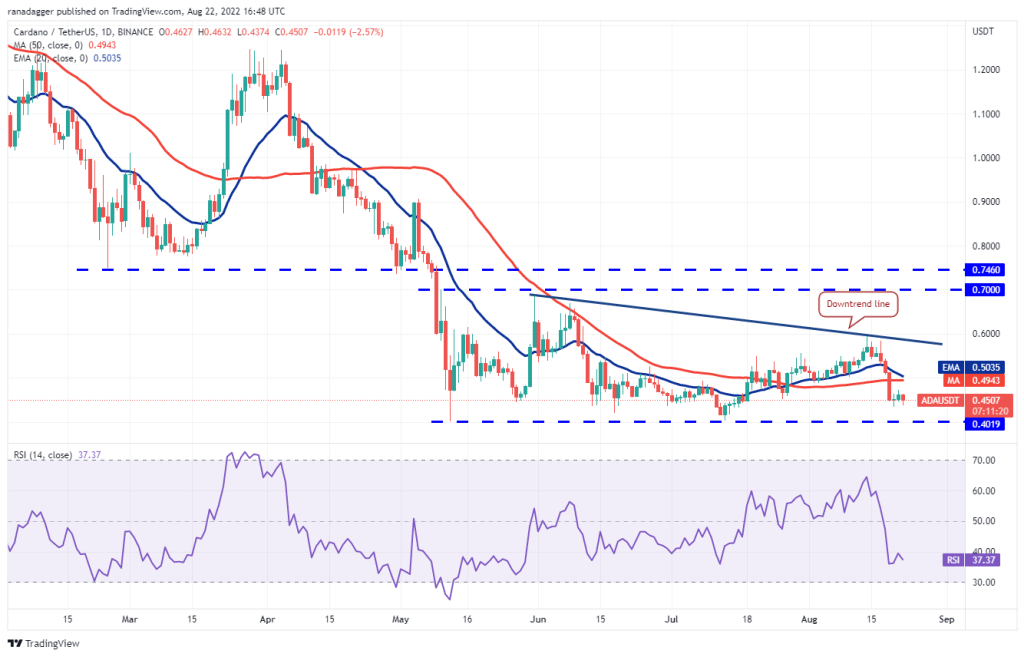
This is an important level to consider because the bulls have successfully defended the level since May 12. A break and close below this support will mark the start of the next leg of the downtrend. However, if the price rises above $0.40, buyers will try to push Cardano price above the moving averages. If they achieve this, it is possible for the pair to rise to the downtrend line.
Left (LEFT)
Solana (SOL) fell below the moving averages on August 19. Thus, it showed that the bears had the upper hand in the near term. Now sellers will try to lower the price to immediate support at $32. If the price rebounds from $32, the bulls will try to push the SOL price above the moving averages. If they are successful, it will suggest that the pair could rally towards the overhead resistance at $48.
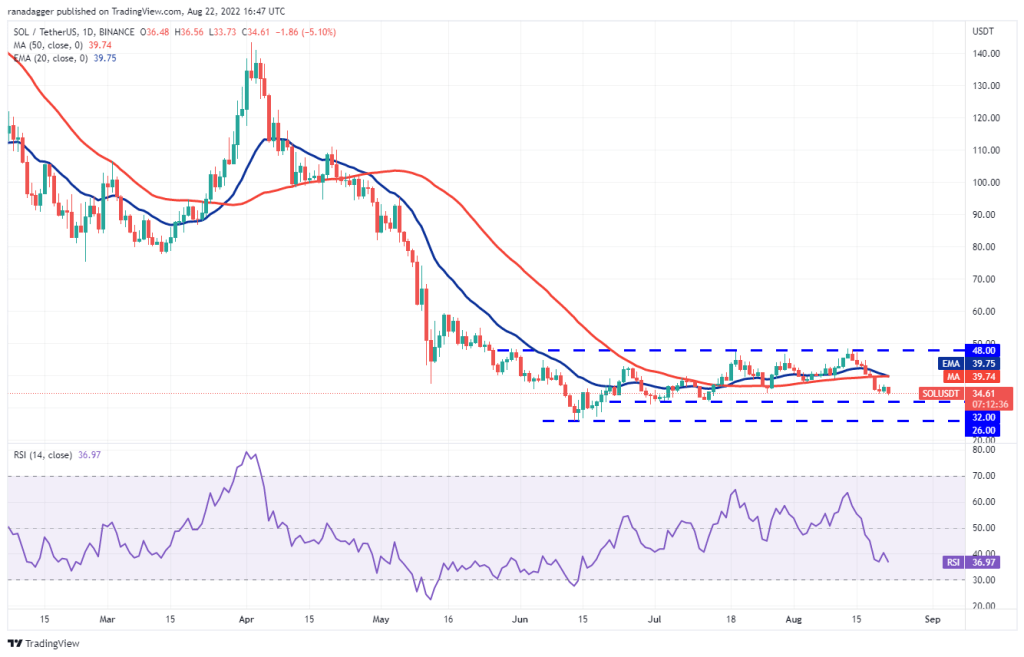
Contrary to this assumption, if Solana dips below $32, the pair will slide to the critical support at $26. Bulls need to defend this level with all their might. Because failing to do so will signal the resumption of the downtrend.
Dogecoin (DOGE)
SHIB rival Dogecoin (DOGE) bounced off the trendline on August 20. However, the bulls failed to break the overhead resistance at the 20-day EMA ($0.07). This shows that the bears do not want to give up their advantage and sell in small rallies. DOGE created a Doji candlestick pattern on August 21. This pattern dissolved to the downside on August 22 and drove the price below the trendline. If the price stays below the trendline, the pair will drop further to $0.06.
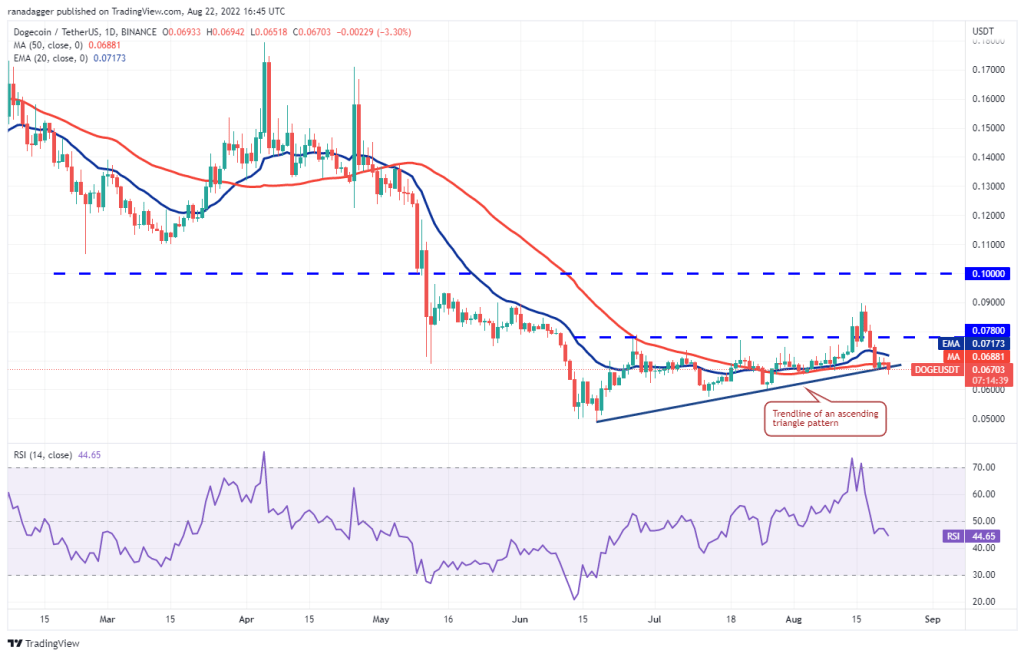
This is an important level for the bulls to defend. Because a break below this will cause the critical support to be found at $0.05. To invalidate the bearish view, the bulls must move Dogecoin above the 20-day EMA. If this happens, it will indicate that the bulls are aggressively buying the dip below the trendline. This could open the doors for a possible rally to the overhead resistance at $0.08.
Polkadot (DOT)
Polkadot (DOT) broke below the 50-day SMA ($7.78) on August 19. Thus, it showed the lack of buying support from the bulls. The bears will now try to push the price down to the strong support at $6. When the DOT is trading within a wide range, traders usually keep a tight stop-loss. That is, they buy the rebound of the support. This improves the risk-reward ratio.
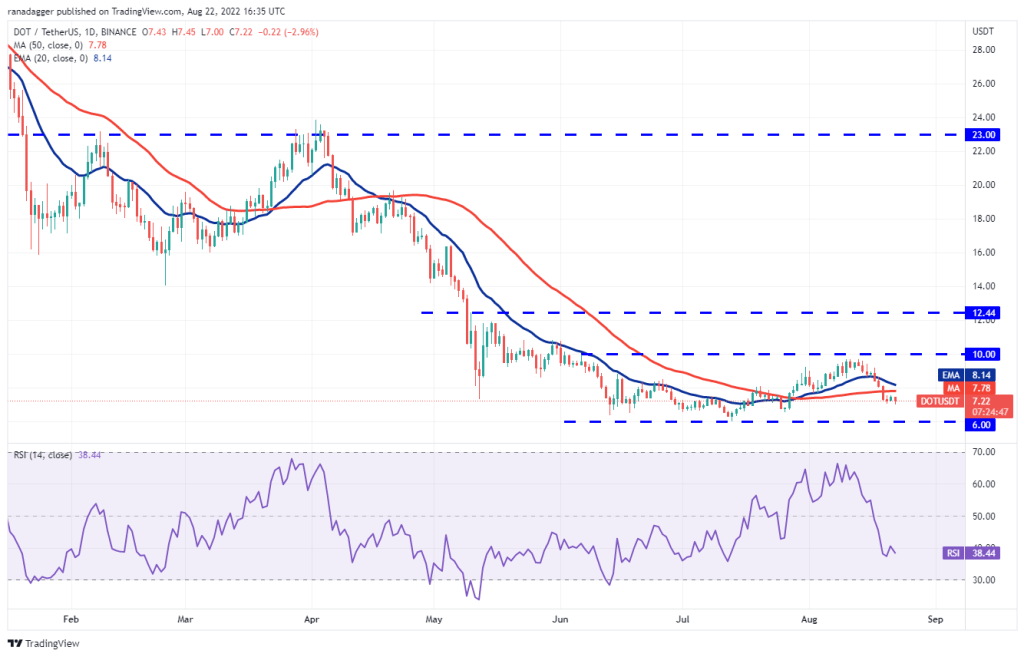
Therefore, a bounce from the $6 support is likely. If that happens, Polkadot will remain range-bound for a while, between $6 and $10. The next trend move could start with a break below $6 or above $10. If the support at $6 gives way, the pair will go to the next leg of the downtrend.
Shiba Inu (SHIB)
The Shiba Inu (SHIB) is witnessing a struggle near the 20-day EMA ($0.0000013) where both bulls and bears compete for supremacy. Buyers are trying to push the Shiba Inu above the overhead resistance at $0.000014, but the bears held their ground. The 20-day EMA has flattened and the relative strength index (RSI) is near the midpoint.
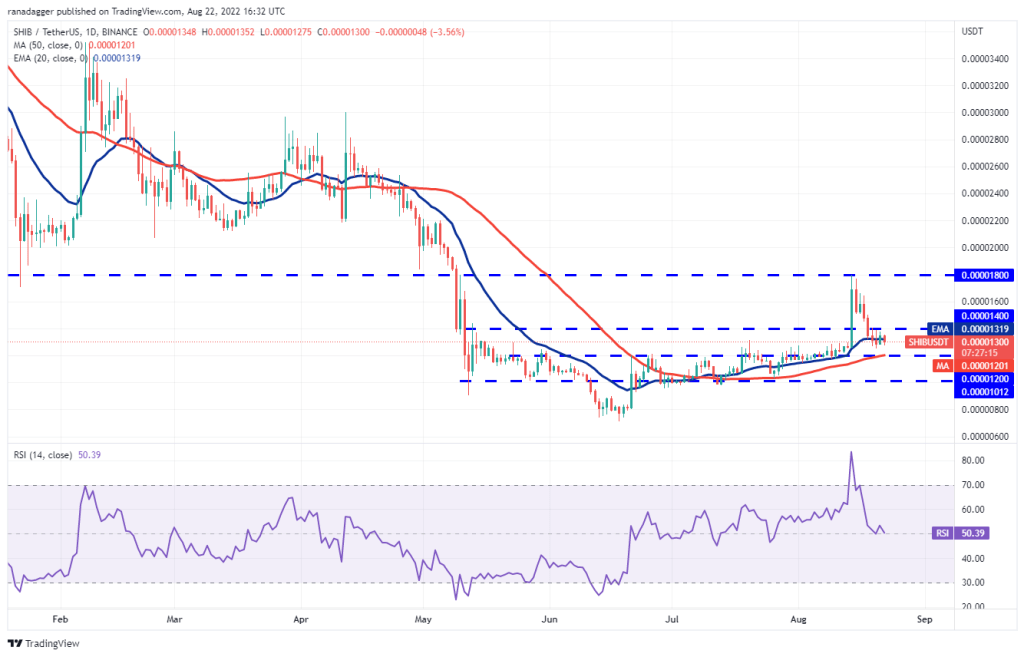
These show that there is a balance between supply and demand. This balance will be in favor of the bulls if the price of SHIB rises above $0.000014. As a result, the probability of SHIB price rising to the stiff overhead resistance at $0.0000018 will increase. However, if SHIB breaks below $0.000012, the price will give support to the bears. If this happens, the meme coin will drop to the next strong support at $0.0000010.
Polygon (MATIC)
Polygon (MATIC) has been consolidating in a wide range between $0.75 and $1 for the past few days. The bulls bought the dip to the support of the range. However, the recovery is facing stiff resistance from bears at higher levels. If the bulls push the price above the 20-day EMA ($0.86), MATIC will attempt a rally towards the dollar overhead resistance, where the bears are likely to establish a strong defense.
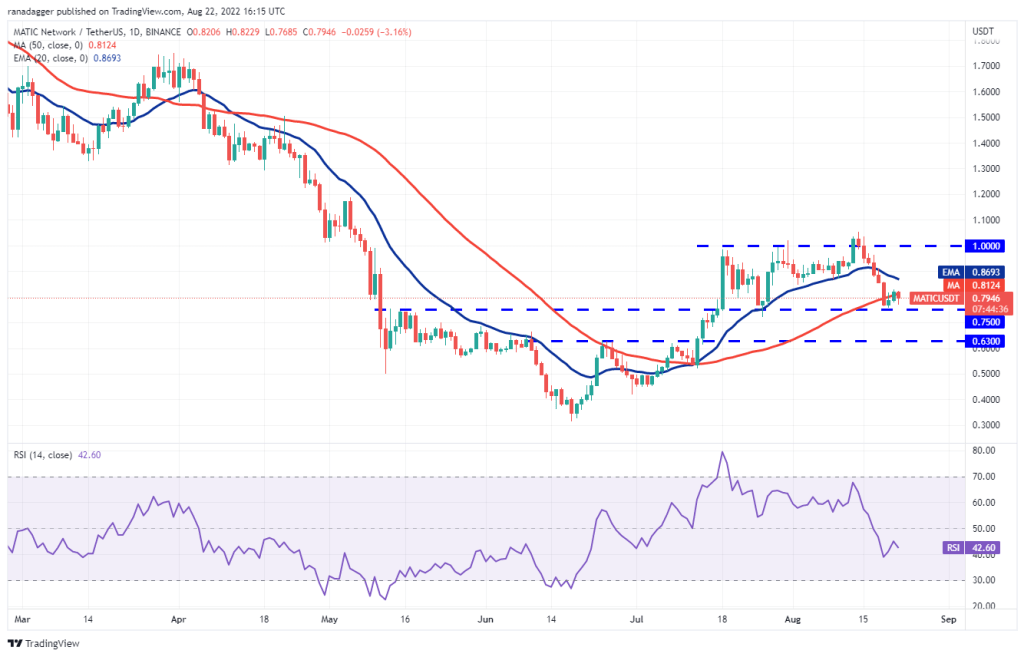
If Polygon breaks down from this resistance, the altcoin will continue its bullish movement within the range for a while. Contrary to this assumption, if the price drops below $0.75, it will indicate that the bears have regained control. The altcoin could then drop to the next support at $0.63.