Altcoin forecasts for the next week attract the attention of investors. In this article, we will talk about four altcoins traded on Binance that some analysts point to bearish. We will also report the expected numbers for these altcoins. Here are the details…
The first altcoin expected to drop: MATIC
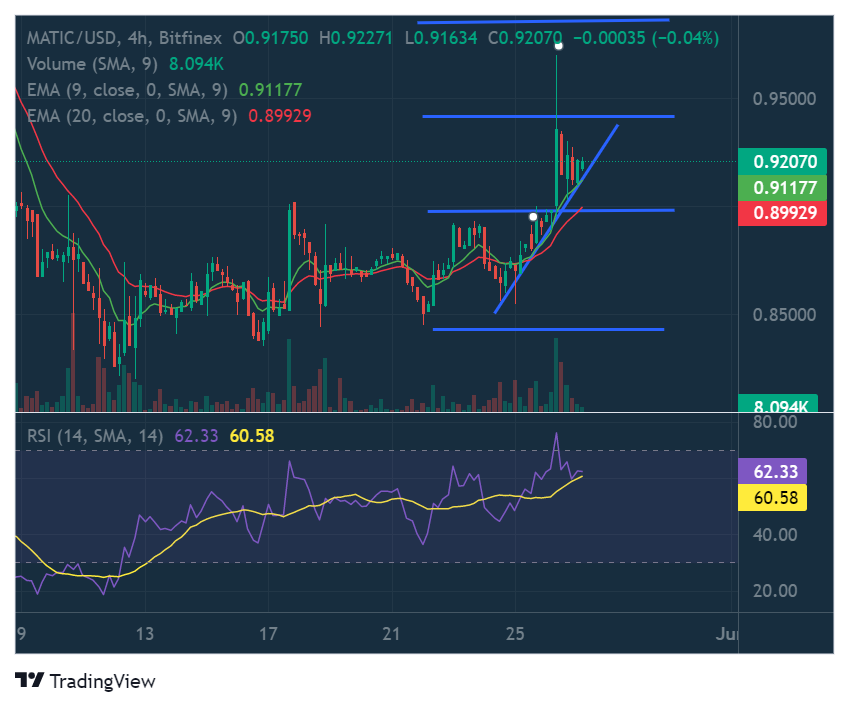
According to CoinMarketCap, the price of Polygon (MATIC) has maintained its weekly positive streak over the past 24 hours. Currently, the coin was trading at $0.9204 after gaining 3.36% in the last day. This positive performance comes after the altcoin’s already positive weekly performance. MATIC has also outperformed the two crypto market leaders Bitcoin (BTC) and Ethereum (ETH) in the past 24 hours. As a result, the altcoin gained 1.92 percent against BTC and 1.90 percent against ETH. However, the altcoin has pulled back a bit from its daily high of $0.9514.

MATIC’s price is hovering above a positive trendline on its 4-hour chart. It was therefore at a decisive point at the time of writing. A break below this trendline would cause the altcoin’s price to drop to the next key support level at $0.89672, then to $0.8439. On the other hand, MATIC stays above the trendline for the next 24 hours, ending the closest resistance at $0.94186 to support.
What is the latest situation for Litecoin, which is expecting halving?
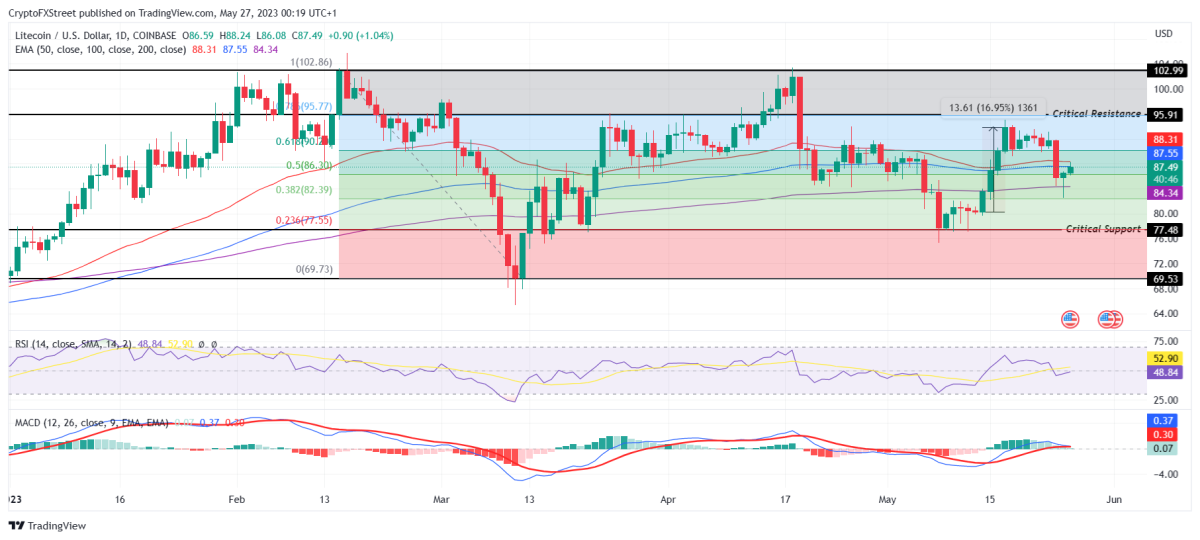
Litecoin price, on the other hand, is currently facing much higher volatility than most cryptocurrencies in the market. Litecoin price has barely increased in the last 24 hours. It is currently trading at $87. According to analyst Aaryamann Shrivastava, the volatility observed in the consolidated price between $102 and $77 left one of the most important groups of LTC holders no choice but to sell.

Long-term holders (LTH) are the group that has held their supply for more than a year. They are not only seen as the most loyal traders, but also act as a major bearish or bullish trigger for price movements. For this reason, selling from them is often considered bearish for crypto. Short-term spikes often indicate profits and historically indicate periods of correction when it comes to Litecoin. So, an increase in price indicates that long-term holders are moving their supply again.
Confirmation of the sales comes as network-wide profit hit a one-and-a-half year high on May 26. Profits of approximately $6.6 billion were recorded on May 26. This figure was the highest recorded since November 2021. The trigger for this sell-off could be the 6 percent crash observed on May 24. This, in turn, may have left investors uncertain about a recovery. So, if the historical examples prove to be correct this time as well, Litecoin price will take a dip. According to the analyst, $ 84, 77 and $ 69 are important as critical support levels.

Is Solana price a trap for altcoin investors?
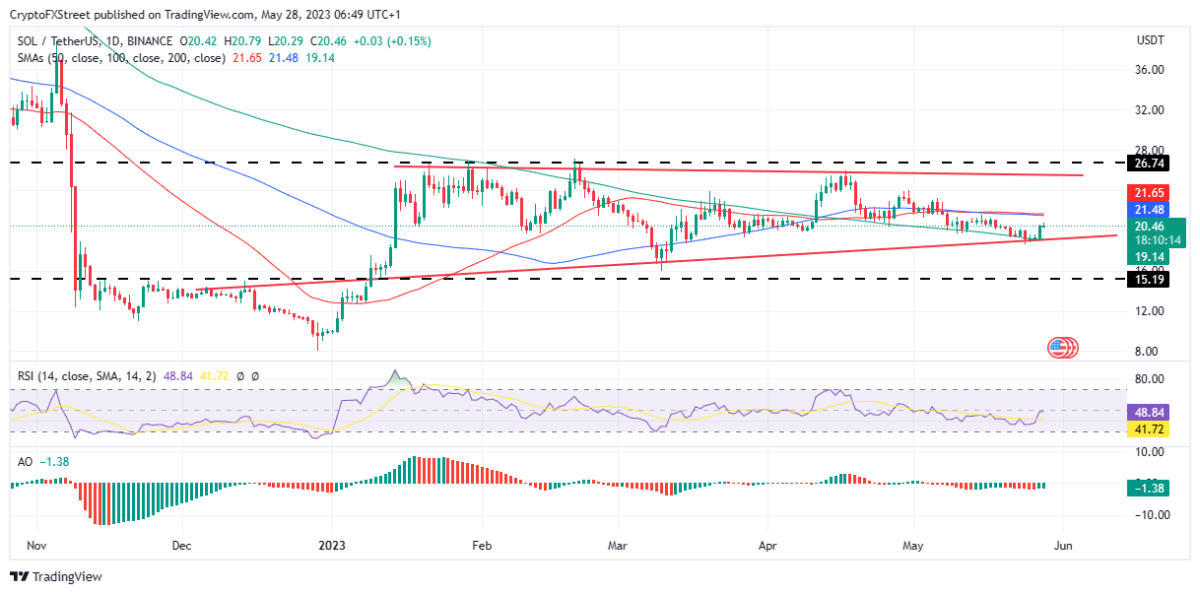
On the other hand, Solana (SOL) price is trading with an uptrend on the daily and lower timeframes. Solana (SOL) price has risen 10 percent in the last four days. Meanwhile, the bulls led the market with four consecutive green candlesticks. However, with this bullish outlook, price action points to a possible reversal while consolidating within an ascending or ascending wedge pattern, according to analyst Lockridge Okoth. An ascending wedge is formed when an asset’s price action moves upward between two converging trendlines.

According to the analyst, this technical pattern is usually bearish. Thus, Solana price slides below the support trendline. An increase in buyer momentum also has the potential to cause the Solana price to move higher. According to the analyst, SOL price must move above $26.74 to break the downtrend. Otherwise, if it fails to gain momentum, a 25 percent drop to $15.19 is possible.
Consolidation process extends for PEPE
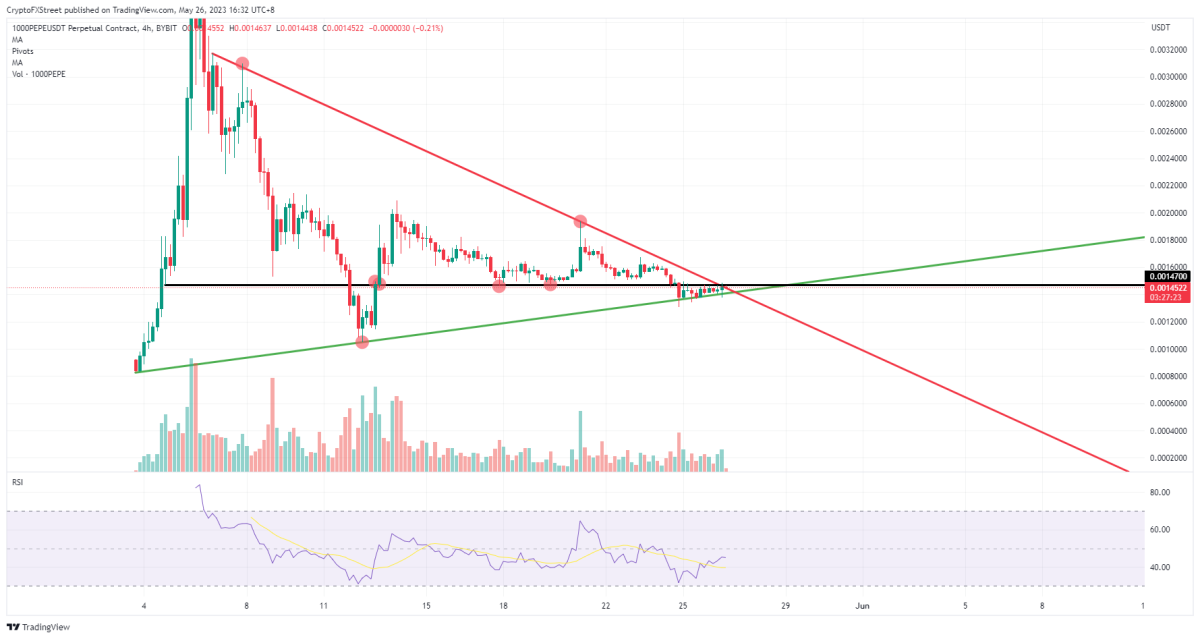
Finally, according to altcoin analyst Filip L., PEPE is among the coins whose price is likely to drop. According to the analyst, PEPE price enters the final stage before determining whether the bulls or bears are winning the game. According to the analyst, when the performances of the past sessions are analyzed and the Relative Strength Index (RSI) is taken into account, it is seen that the bears will win the game. Therefore, the analyst suggests that the green ascending trendline will soon be broken. Thus, he mentions that the price should head towards $000000010.

PEPE price action is reflected in the RSI, which is still below the par and is starting to slope downward even now. The 4-hour chart shows lower highs coming soon. So there is a difference between what the chart is telling us and what the RSI is warning about. Looking at the volume chart, there has been some buying in the last four candles, while selling is only marginal. This ultimately signals that more bulls are in the trade and the breakout is higher. If this happens, there is a rapid rise to $0.0000020000 behind this bullish signal.


