
Dogecoin carries the risk of selling, according to crypto analyst Valdrin Tahiri. Analyst David says the price of Radiant Capital could drop another 31 percent. Another analyst, Filip L, argues that AVAX will suffer. Also, the analyst expects a 10 percent loss for the Shiba Inu. The analyst, nicknamed Altcoin Sherpa, talks about $25,000 for the leading cryptocurrency.
DOGE price prediction: Is collapse imminent?
Technical analysis on the long-term weekly timeframe gives contradictory signs for the future Dogecoin price trend. While the price broke out of the long-term descending resistance line (dashed), it failed to rise above the $0.115 resistance area. Rather, the price was rejected (red icon). It also formed a long top wick. This means that buyers are unable to sustain the increase. Therefore, it is considered a bearish sign. Rather, sellers took over and drove the price down as a result. Following the rejection, the meme-coin has fallen to a rising support line since June 2022. This is the fourth time the price has touched the line.
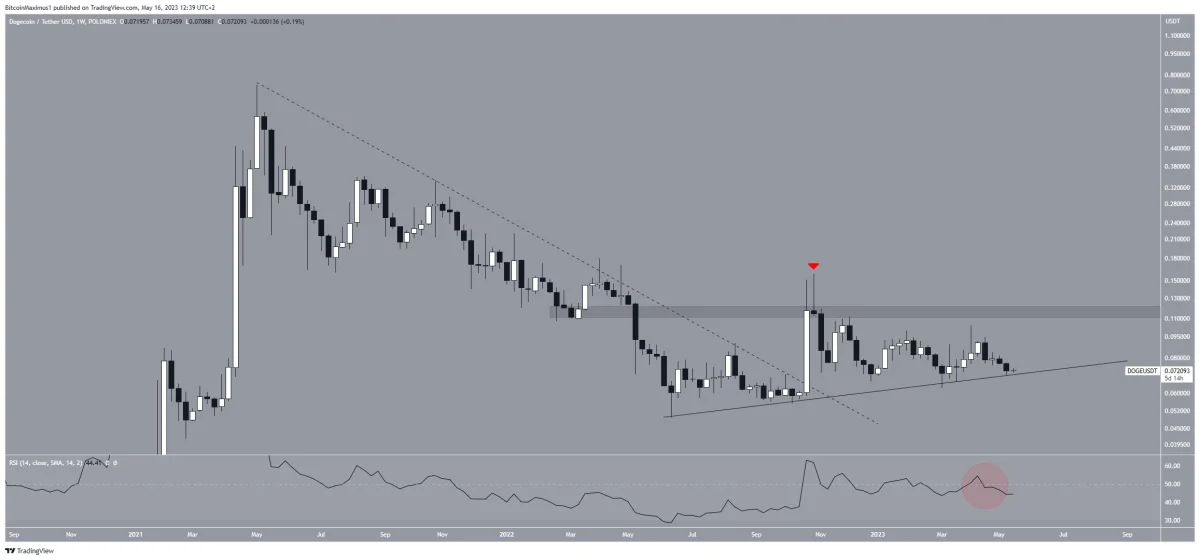 DOGE Weekly Chart / Source TradingView
The weekly Relative Strength Index (RSI) provides a bearish outlook. The indicator declines below 50 (red circle) as a bearish trend-related sign.
The daily timeframe data is in line with the bearish DOGE price forecast on the weekly timeframe. Price action shows that DOGE price has been trading inside a descending triangle since November 2022. The descending triangle is considered a bearish pattern. So it often leads to breakdowns. Currently, the price is trading at $0.067, which is very close to the bottom of the triangle. A break across the entire height of the triangle will push the price up to $0.04. Thus, DOGE will fall to the lowest level of a new year in this process.
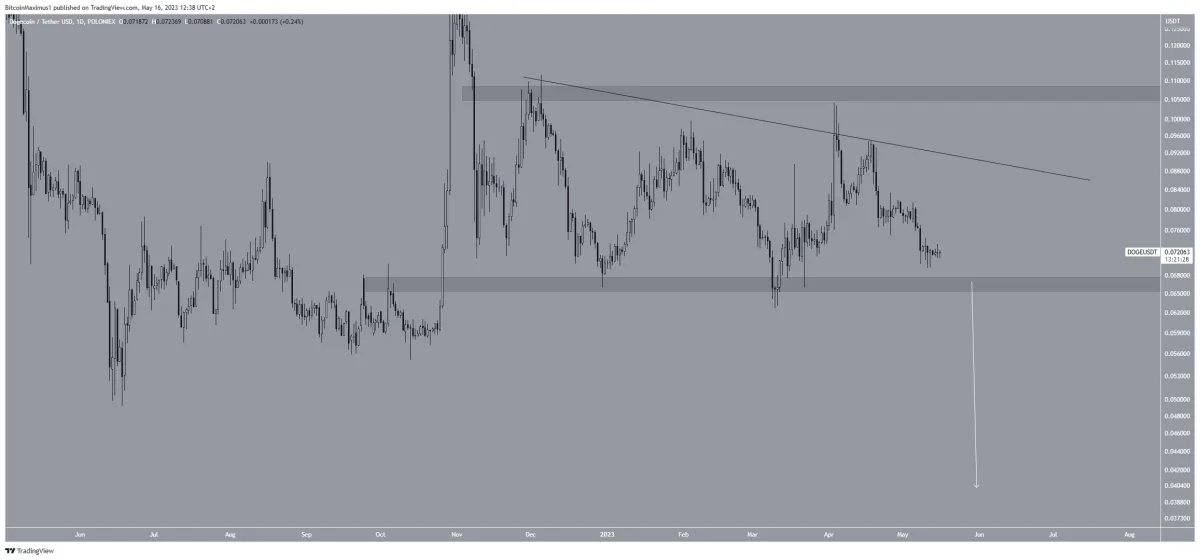 DOGE Daily Chart / Source TradingView
However, a break from the resistance line of the triangle will invalidate this bearish long-term DOGE price prediction. In this case, the most likely route for future price action would be a price increase to $0.105.
This cryptocurrency price is at risk of falling another 31%
Radiant Capital (RDNT) price has been trading in the range of $0.31 to $0.5 since March 16, 2023. The price tested both the support and resistance of the range multiple times. It is currently in the process of retesting the support level of the range. The bulls tried to keep the price at the support level. However, the failure to initiate a recovery over the past few days points to a lack of purchasing power at higher levels.
The RSI indicator has dropped below the support line that has formed since RDNT price formed a range. Hence, it supports the possibility of further declines. Such breaks in the RSI often lead to similar breakouts in price action. Therefore, it is possible for the coin price to drop below the $0.31 support in the coming days. In this case, the nearest support level stands at $0.21, which corresponds to a 31% drop from the current price level.
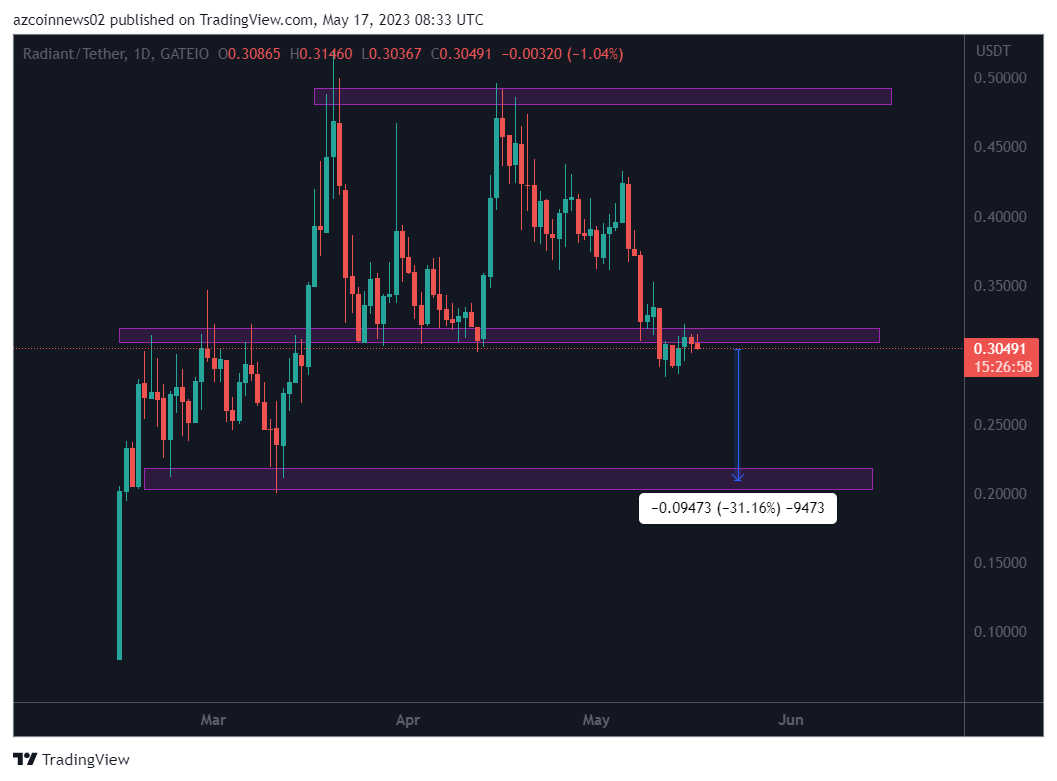 RDNT daily chart / Source TradingView
The most likely expectation is for RDNT price to drop to the next support level at $0.21. However, this perspective will be invalidated if the price retraces the $0.31 support level.
AVAX will suffer more soon!
Avalanche price is poised for another landslide victory for the bears as there is no end in sight to this painful trade yet. Another bearish element is perceived from the charts as the bearish triangle is at hand. Another 10% drop will occur behind this bearish triangle, which is slowly but surely approaching the endgame of a downside break. AVAX traders will watch $14.56, which acts as the base for the bearish triangle in this process. The coin had solid support last Friday. After that, there will be a rapid bearish movement. A sudden drop to $13 is possible with the nearby monthly S2 support for support.
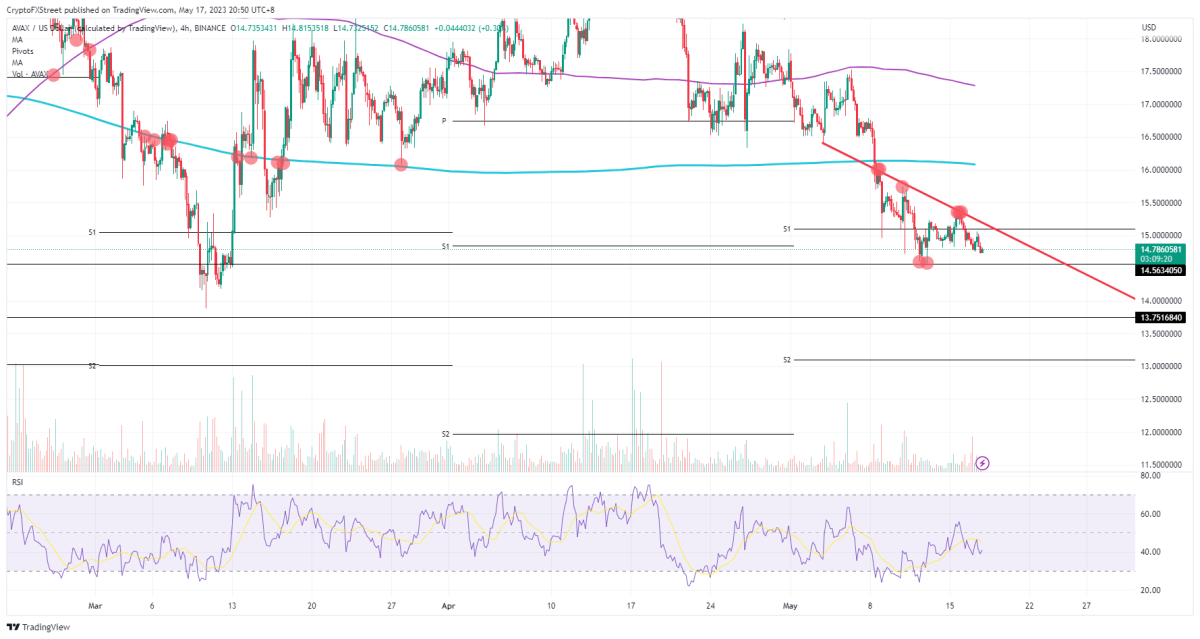 AVAX 4-hour chart
However, it is still possible to retain support. A break above the red descending trendline would be a major bullish signal for investors and traders. In this case, the bulls are likely to rally higher here with a quick knee-jerk correction. Although quite far, $16 will be on the cards with the 200-day SMA as the first major cap on the upside to be tested.
Shiba Inu bulls put on a dismal performance
SHIB is witnessing a dismal performance of the bulls. Because for now, the only move they can trigger is a sideways price move. At least the idea would be to move up towards the upper band of the descending trend channel. But bulls are not suitable for this. Worse still, selling pressure is building as lower highs have been detected since Monday.
Meanwhile, on the SHIB, the bears are teething into the current low of around $0.00000860, which is gnawing the bullish support. Once it gives way, a quick drop to $0.00000840 monthly S2 support makes sense. If even the S2 doesn’t hold up, a new low of $0.00000800 and $0.00000799 for 2023 is imminent, adding a 10% loss to its performance.
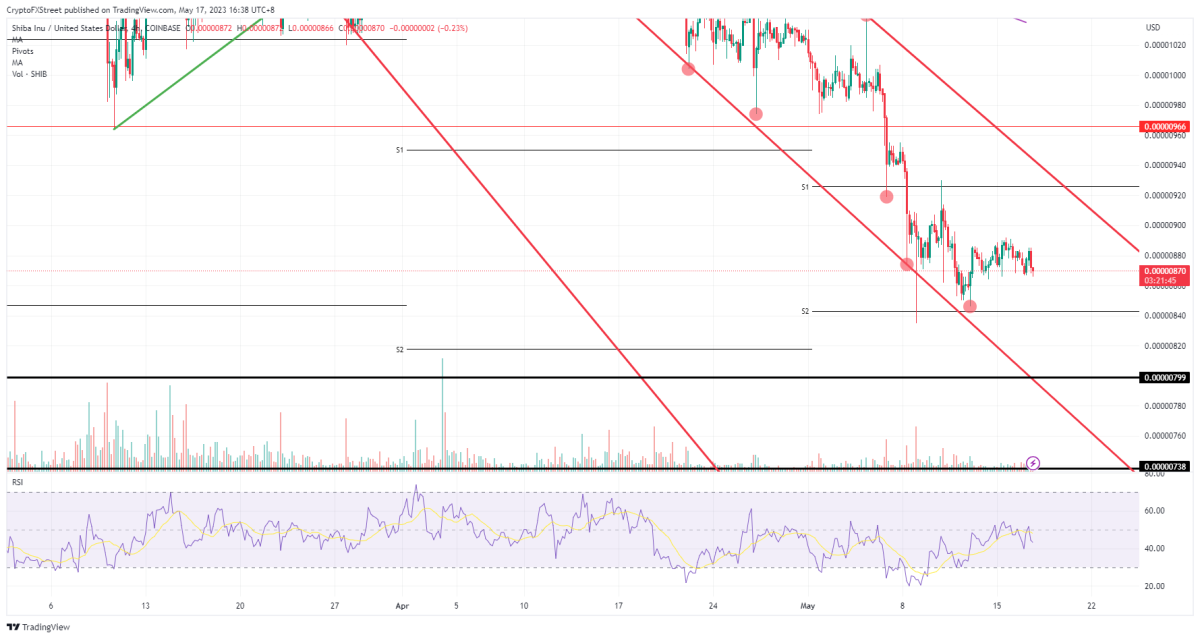 SHIB 4-hour chart
For a few days, SHIB has been holding the area around $0.00000860. This means that bears can break their teeth at this level. If this is the case, it indicates that the bulls continue to buy against the short sellers. If the bulls can handle the price and move further towards $0.00000890, a ‘squeeze’ could force the SHIB to rise towards $0.00000920.
Leading cryptocurrency may drop to $25,000
Analyst Altcoin Sherpa predicts a huge surge for Bitcoin (BTC). Sherpa also states that there is no clear trend in the BTC chart. Altcoin Sherpa later notes that a key high on BTC’s daily chart would be the $26.5k mark. The analyst’s reasoning behind this is that BTC always manages to close above this price point just hours after falling below the level in the last 2 months. In the medium term, the analyst does not rule out the possibility of BTC reaching $29,000. On the other hand, he predicts a decrease towards $25,000 later this year. However, it does not explain when and how this drop in the price of BTC will occur.
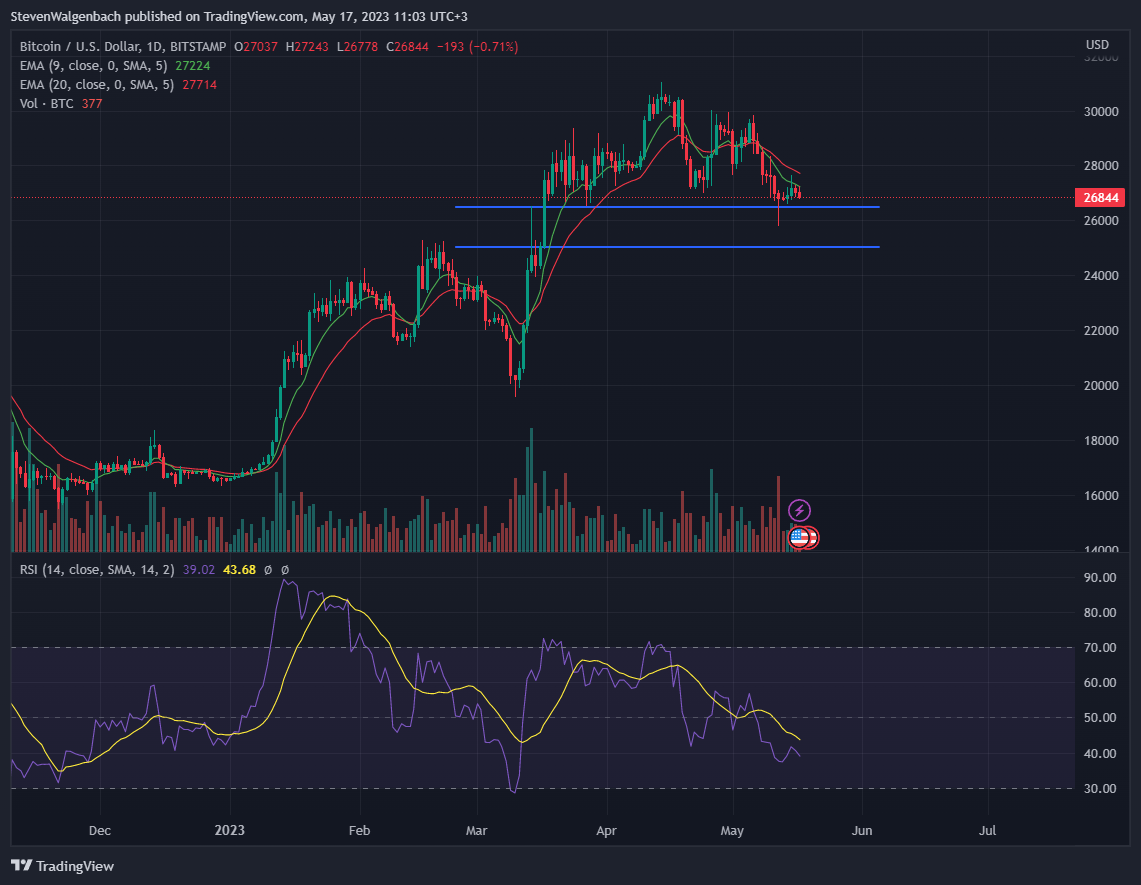 BTC daily chart / Source: TradingView
Altcoin Sherpa adds that the level has too much confluence to justify its $25,000 downside target. First, $25,000 has been a key support and resistance level for the past few months. Moreover, this level is also where the 200-day EMA line and the 0.382 Fibonacci Retracement Level are currently located. The analyst states that if BTC continues to hover above $26.5k over the next few weeks, the bearish thesis will be invalid. If that happens, the analyst says BTC will likely rally as high as $30,000.