
All eyes are on next week’s Fed decision. Gold, on the other hand, is reversing the two-day bearish momentum on Friday. ANZ Bank strategists expect the yellow metal to confirm an upside move. On the other hand, market analyst Dhwani Mehta says that gold looks vulnerable.
“Gold is consolidating, range looks unstable”
Gold has been trading in the $1,800-1,860 range since mid-May. Strategists at ANZ Bank, on the other hand, are waiting for confirmation of an upward move. However, for this to happen, the yellow metal needs to break past $1,900. Accordingly, strategists make the following predictions:
The current price range of $1,800-1,900 will not provide a clear direction until prices break both sides of the range. A convincing break above $1,900 will be necessary before a short-term bullish outlook. This level also marks a trend break. If this level is broken, gold will open the doors to the previous $1,950 and $2,000 levels. Key supports in this analysis are $1,800 and $1,760.

“Tightened central banks have rekindled growth fears”
As you can follow from Cryptokoin.com news inflation rates are rising. Also, persistent fears of a possible recession still persist. This causes investors to seek a safe haven. In such an environment, gold is trading with significant gains on the last trading day of the week.
On the other hand, worldwide tightening of central banks to suppress inflation rekindled growth fears. Warm inflation and worries about the pre-Fed meeting continue to support the sentiment around the dollar. However, despite a small decline in US Treasury yields, the precious metal posted significant gains.
Key levels to watch for gold price
Market analyst Dhwani Mehta uses Technic Confluence Detector (TCD) to determine the direction of gold. TCD shows gold price holding support from the crucial daily 200 SMA at $1,842. Dhwani Mehta continues his analysis in the following direction.
However, a sustained move below the latter would risk $1,840 the previous day’s low. At this level, the daily S1 pivot point and the weekly Fibonacci 23.6% retracement converge. The next relevant downside target is $1,833. This level is the combination of the monthly Fibonacci 38.2% retracement and the daily pivot point S2.
Gold buyers follow $1,829 as a line in the sand. This level is where the previous week’s low intersects with the weekly pivot point S1.

On the upside, there is a strong resistance at the $1,845 zone where the 5 4-hour SMA, daily and weekly Fibonacci 38.2% retracements all coincide. Further up, the bulls will be challenged where the 5 daily SMA, the 61.8% daily Fibonacci retracement and the 10 daily SMA converge at $1,850.
Meanwhile, an acceptance above the latter will open the doors for a fresh advance towards the previous day’s high at $1,855. Also, above this, the weekly Fibonacci 61.8% retracement to $1,857 will be examined. The meeting of the monthly 61.8% Fibonacci and daily R2 pivot point at $1,863 will be a tough nut to crack for gold bulls.
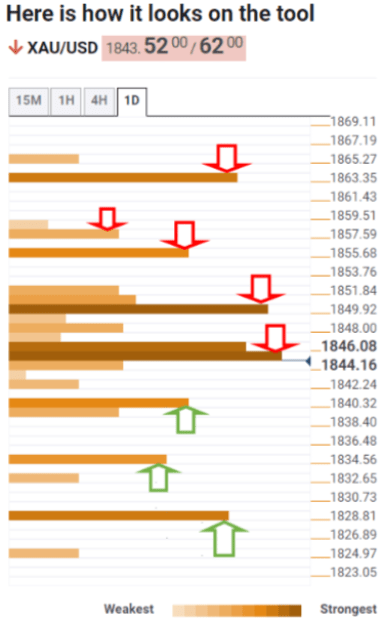 Technic Confluence Detector