Bitcoin left behind the first half of 2022. With record negative returns, analysts expect the bearish to continue, especially if a certain support level is breached. This support level could decide the fate of BTC…
Bitcoin levels for the second half of 2022
Bitcoin price fell 56% in Q2, recording the highest negative second-quarter return in 11 years. Meanwhile, it traded in a tight range, falling below the 200-week SMA at around $22,500. Bitcoin price’s reaction to the MA line, which acts as a resistance, shows the strength of the bullish situation, while the $19,065 support level reveals the bears’ intentions.
Assuming bitcoin price turns roughly $23,480 to support, it will indicate that buyers are in control. This move will also reveal that a recovery rally is in play.
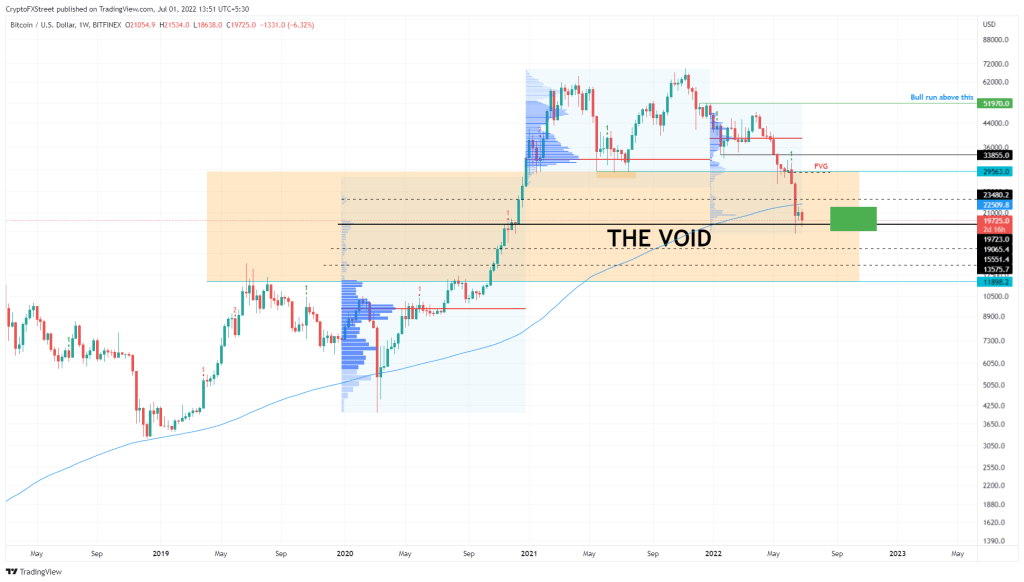
Such a situation would suggest that BTC will continue its rise to the next tough hurdle at $29,563. This is where things get complicated for Bitcoin. According to analyst Akash Girimath, a decisive move above the above-mentioned resistance will pave the way for Bitcoin price to reach the highest trading volume control point (POC) of 2022 at $38,990. However, the overall bearish bias is still dominant and only a weekly candlestick above $52,000 will create a higher top and confirm a long-term reversal.
What do on-chain metrics say about Bitcoin price?
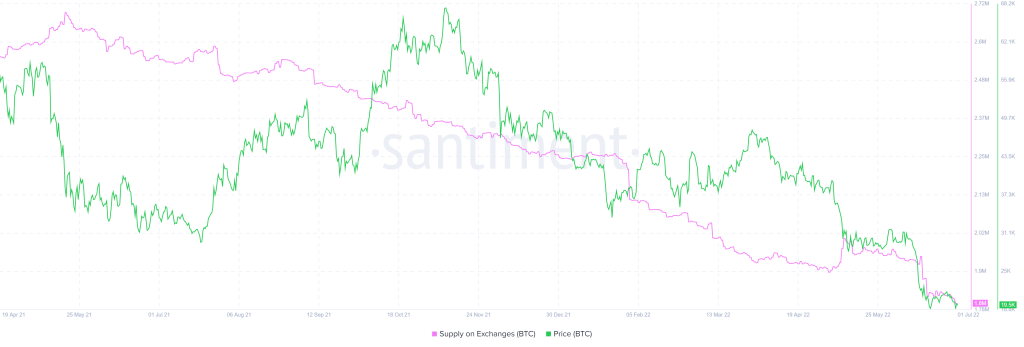
This bullish outlook is passively supported by on-chain metrics. The supply of BTZ on exchanges has been down from 1.94 million to 1.8 million in the last two weeks. This 7.2% drop reveals that investors are withdrawing their BTC from exchanges. Thus, it can be said that it reduces the effective sell-side pressure for Bitcoin.
Potential Bitcoin bottom formation
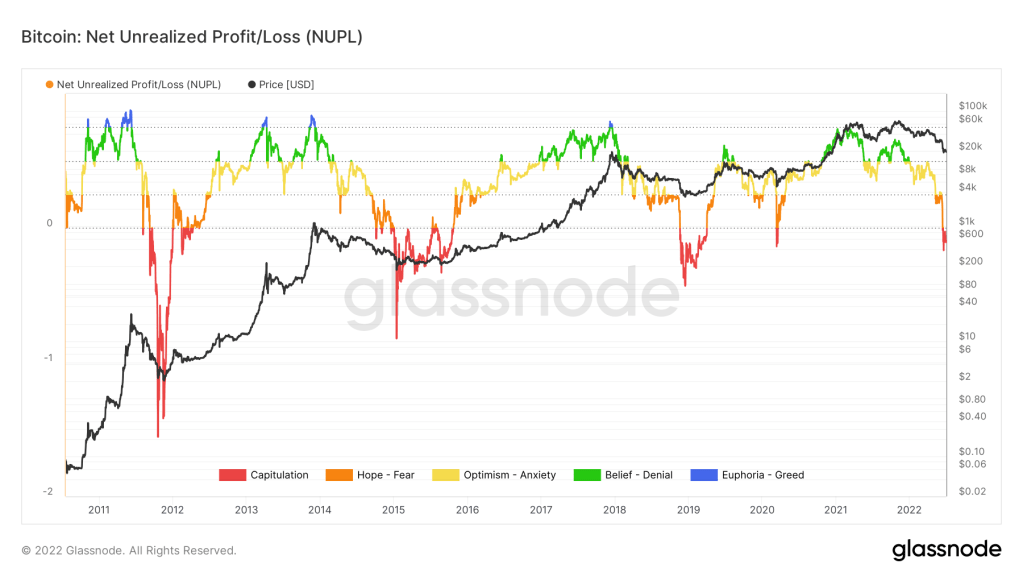
The next indicator is Net Unrealized Profit/Loss (NUPL), which from a historical perspective indicates that a bottom may occur. However, a quick look at the chart shows that the bottom formation occurred over a period. Also, it turns out that it wasn’t just a turning point.
The NUPL indicator measures the difference between traders with relative unrealized profits and relative unrealized losses. The result is used to represent market sentiment. The shift in NUPL’s numerical value can be used to understand the sentiments of investors. This, in turn, helps determine the peak and bottom times of the market.
The market often turns upside down when NUPL detects that investors have entered the “Greed” stage. As a result of this move, price corrections often gain momentum. This shifts the market sentiment from Greed to Denial, Denial to Worry, Anxiety to Fear, and Fear to Surrender.
Capitulation typically marks the bottom of the loop
Bitcoin price plunged from greed to fear as ATH dropped from $69,000 to $30,000. Another drop in BTC price below $30,000 in June 2022 saw market sentiment dive from fear to capitulation.
It is worth noting that this indicator has been giving accurate results for the last ten years. It also shows that BTC traders are capitulating, which often marks bottoms for each cycle. However, an interesting observation is that the capitulation time and size decrease with each cycle. Therefore, NUPL’s current position cannot definitively say that it is in a market bottom. But at least it can be assumed that the bottom formation process has begun.
The volume profile indicator above shows that the $19,065 support level is a crucial point. A breakdown of this level shows a 36% drop to $11,898 due to the lack of high volume nodes.
However, traders can expect a slowdown at the $15,551 and $13,575 support bases in some cases. If the bears manage to break the $19,065 support, the $12,000 psychological level seems possible.
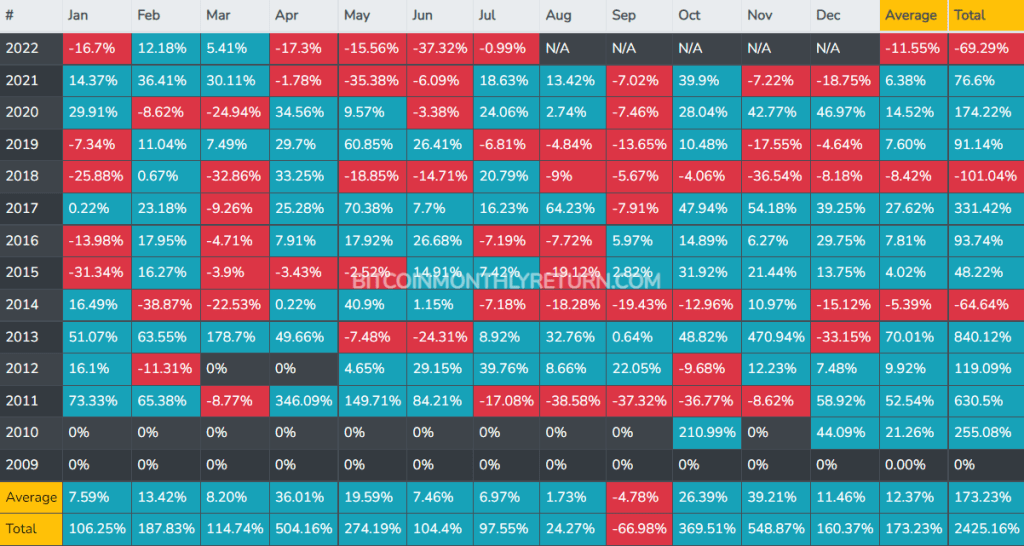
On the other hand, the monthly returns of Bitcoin price indicate that the second quarter was a quarter with single-digit returns possible. However, the upcoming third quarter is much worse, with an average return of -5.4%. Therefore, it seems highly unlikely to expect BTC to rally in the third quarter.
To sum it up, a weekly candlestick near $19,065 will trigger a collapse for Bitcoin price, causing it to drop violently to $12,000 or lower. According to the analyst, investors should be careful when opening leveraged long positions based on the assumption that the bear market is over.