Bitcoin set an annual high when it hit $25,270 last Thursday. The latest rally reflects an 18.25 percent increase from the local low of $21,376 set after the first rally in January 2023. So what’s next? How will BTC, the largest cryptocurrency with its market value, act in the new week? Here is the Bitcoin prediction from the important names
Bitcoin price has been volatile this week
Bitcoin reached its highest price in the last eight months at $ 25,270. Bitcoin rose $1,820 in a single day in a market rally that surprised many. According to analysts, rising dollar value and falling inflation are behind the recent price increase. On the contrary, the on-chain data point to a different development. cryptocoin.com As we have also reported, the rally’s $ 1.6 billion USDC inflow from anonymous major wallets drew attention. It is thought that the price increase in the market took place after this fund inflow.

Technically speaking, the Bitcoin surge comes a few days after Bitcoin hit the weekly “death cross”. This occurs when a short-term moving average (MA), usually the 50-day MA, falls below its long-term moving average, usually the 200-day MA. While the pattern seems to point to bearish movement, death cross has followed short-term above-average returns in recent years.
Important Bitcoin prediction: $56,000 to be seen?
According to William Noble, director of research at Emerging Assets Group and former analyst at Goldman Sachs and Morgan Stanley, Bitcoin could head towards the $56,000 region. Correctly predicting that Bitcoin will rise from $20,000 to $40,000 in late 2020, the analyst said that the flagship cryptocurrency could return to its predicted price level by taking another parabolic move from consolidation.
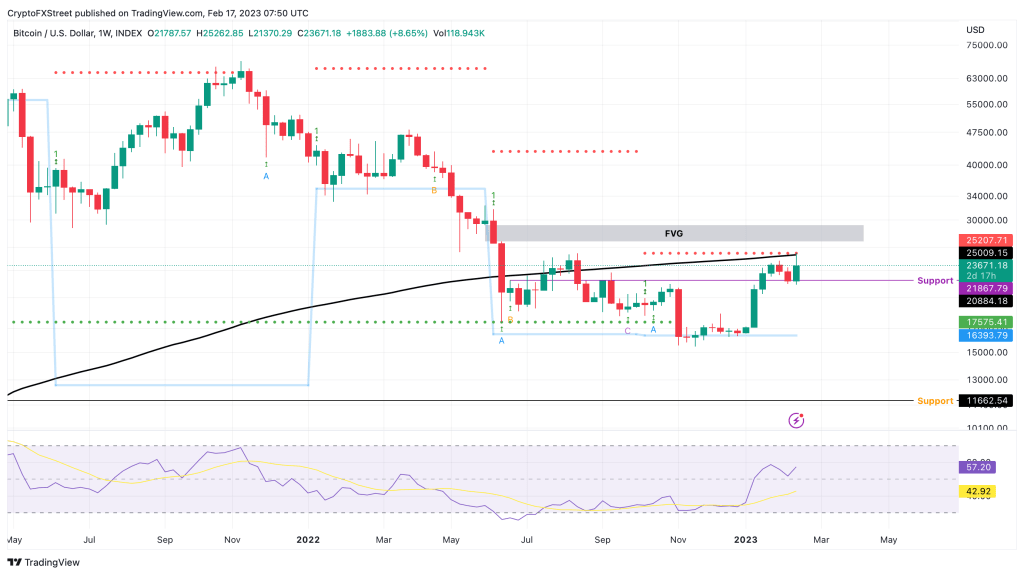
According to Akash Girimath, another cryptocurrency analyst, Bitcoin price is showing a clean bounce from a stable support level that paused its reversal and restarted the 2023 bull rally. While the recovery was impressive, it faced a lot of selling pressure as it approached the 200-day Simple Moving Average (SMA).

Bitcoin price ready to cover more ground
According to Girimath, the weekly chart is currently showing two critical levels – the 200-day SMA at $25.009 and the $25,207. Further examination of the Relative Strength Index (RSI) shows that it has bounced off the 50 level and potentially renewed bullish momentum. Therefore, the 2023 bull rally, which provides a 43 percent increase, could continue and push the Bitcoin price higher. In a situation where BTC surpasses the crossing of the roughly $25,200 resistance, the next stop would be $43,000 as indicated by MRI.

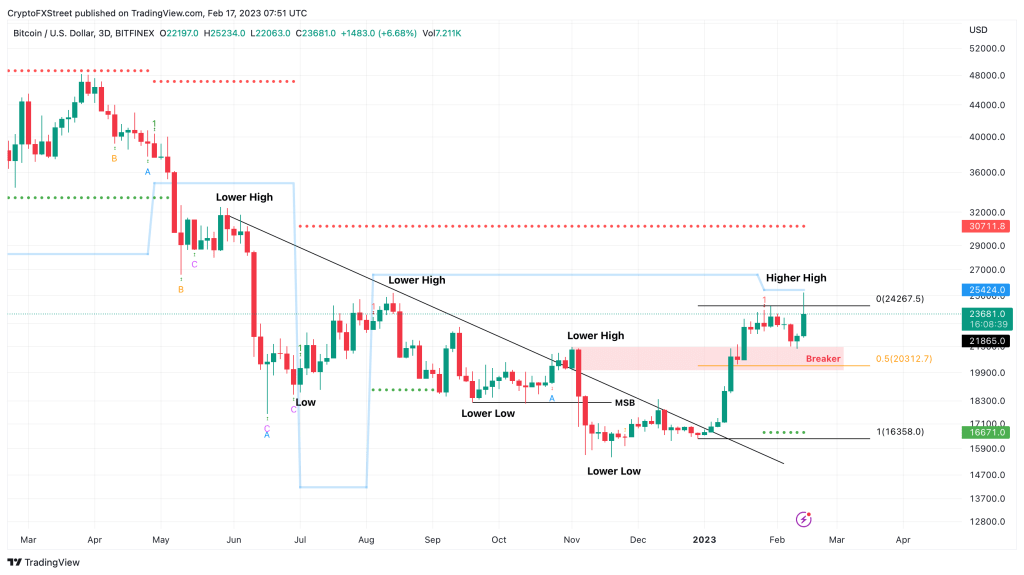
The three-day chart for bitcoin price shows the same picture with a slightly different view. The 2023 bull rally took the largest cryptocurrency up 48% from $16,358 to $24,267. BTC tried to break through this level after bouncing off the bullish breaker as seen in the chart below. However, the momentum waned after raising the range to $24,267 and tagging the $25,234 hurdle. On the other hand, unlike the weekly chart, which predicts a bullish target of $43,000, the MRI indicator on the three-day chart predicts a much more tangible target of $30,700.

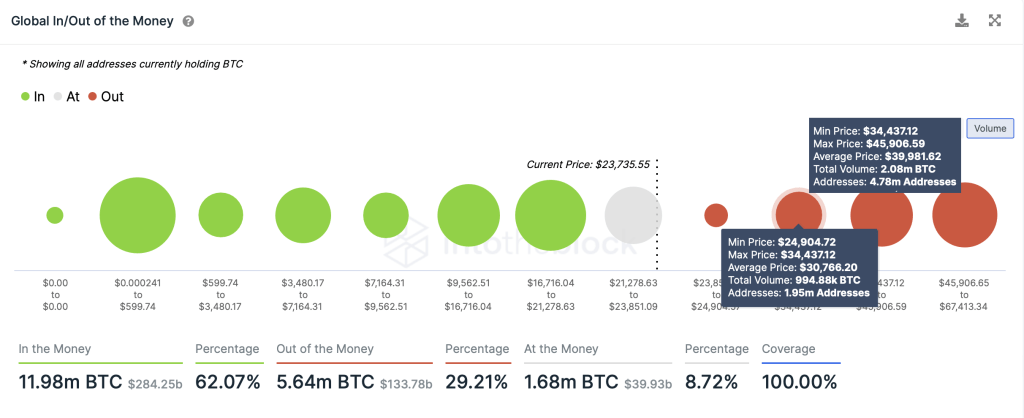
IntoTheBlock’s Global In/Out of the Money (GIOM) model shows that the immediate resistance cluster of its losing traders is weak. The next major hurdle comes in at $30,766, which coincides with the targets seen on the three-day chart. There are 1.95 million addresses that have purchased approximately 995,000 BTC, and are currently “Free of Charge”. Therefore, a move to this area may cause these holders to dump their holdings and resist the uptrend. Therefore, the probability of forming a local top at $30,000 is high.
There is also the possibility of falling
While the long-term outlook for Bitcoin looks relatively safe, in the short-term market participants, especially whales, seem to be profiting after the retest of the $25,000 psychological level. The whale metric tracking transactions from investors valued at $1 million or more spiked after BTC rallied on February 16. If this outlook persists and investors continue to gain, selling pressure could cause a trend reversal. The ensuing snowball effect could force Bitcoin price to produce a daily candlestick near $21,867, thereby creating a lower bottom and invalidating the bullish thesis. This trend could send BTC to test $16.393.


