It marks the end of the recovery as Bitcoin price is suppressed below $17,000. The FTX crisis broke the leading cryptocurrency completely out of the $20,000 region. Analysis shows that he does not have enough strength for now to get back on his feet.
Bitcoin price suggests a rough weekend at current levels
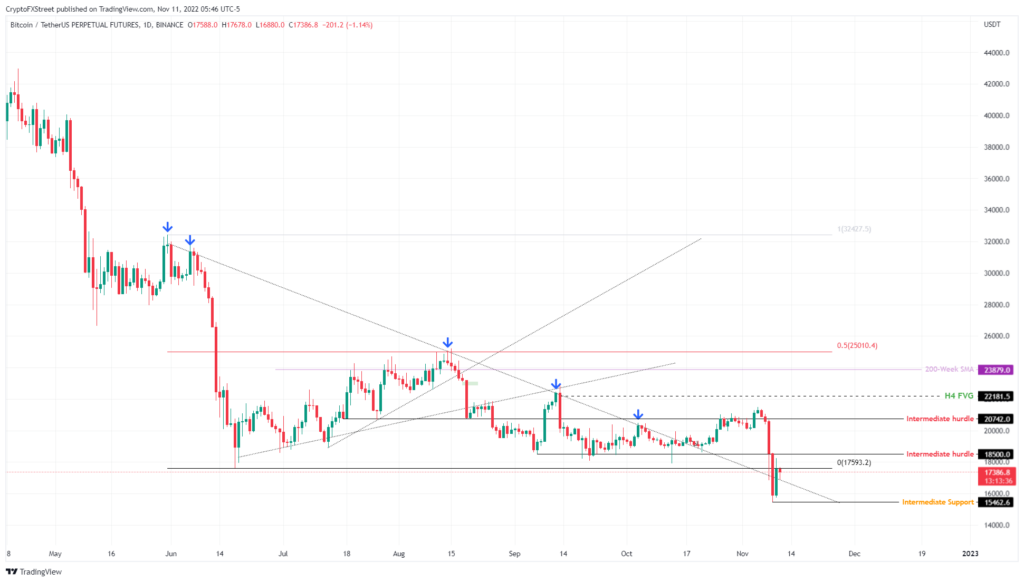
Bitcoin price has been stable for the past 24 hours, showing a clear lack of buying. Selling dominance comes as BTC encounters resistance at $17,593, which has played a key role since June 2022. FXStreet analyst Akash Girimath predicted a narrow move between $17,593-15,462 going forward.
However, there are chances of a slight bullish scenario after the $17,593 resistance is turned to support. This development will pave the way for BTC bulls to rise even higher. It will also allow it to retest the $18,500 hurdle, which roughly coincides with the 2022 volume control point.
Bitcoin price will largely depend on news from FTX
In a more bullish situation, once the price of Bitcoin surpasses $20,000, investors will have the right to speculate on retesting $20,742 and $22,181 this time around. But right now the outlook is largely dependent on what’s going on around FTX. The news from former CEO Sam Bankman-Fried and the stock market that he remains on the team will directly affect the trend of the market.
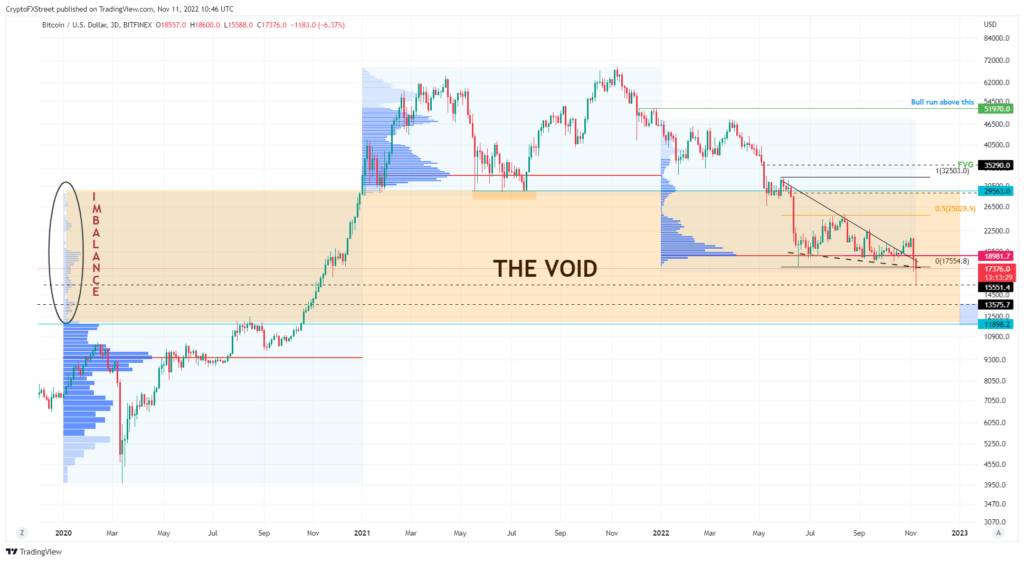
In such a case, the next level of support that traders should watch closely will be $15,551. However, a breakout of this resistance marks a brutal sell-off to the $13,500 level. Analyst Girimath says that Bitcoin price is likely to form a local bottom between $13,500 and $11,989.
Regardless of the current market outlook, investors need to be very careful with the ongoing battle between FTX and Binance and the involvement of TRON’s Justin Sun in rescuing users through the conversion of assets using TRX. Resolving this turmoil will be critical in providing a directional bias for investors. Bitcoin has already weakened massively in the tension between FTX and Binance. The situation is currently at its worst, says PlanB, inventor of the Stock-to-Flow (S2F) model.
Bitcoin’s (BTC) monthly RSI data at all-time low
In his new analysis, PlanB, the inventor of the S2F model, which points to $ 100,000 in BTC price, tried to explain why Bitcoin is currently oversold. On November 10, the analyst examined the RSI data on Bitcoin’s monthly timeframe. The 1M RSI for the BTC/USD pair fell to 40.5 in November, according to PlanB.
#bitcoin has never been weaker. Monthly RSI 40.5 pic.twitter.com/TJ48VfwseB
— PlanB (@100trillionUSD) November 10, 2022
In the 1970s, J. Welles Wilder Jr. Developed by , this indicator is used to show a trend in recent price changes. This allows analysts to check whether it is overbought. In equity markets, when the RSI falls below 30, it is considered to be oversold. However, the 40.5/100 level for such a large time frame is very painful for the bulls. Bitcoin’s 1M RSI has never been lower in its history.
Double bottom confirmed?
PlanB also said that Bitcoin’s plunge to $16,000 is a “second capitulation” that marks the bottom of this bear cycle. The first was related to the LUNA/UST crash in early May. According to the analyst, this pattern closely resembles that of the 2015 cycle, with a double bottom associated with the hacking of the Bitstamp exchange and the activation of Bitcoin’s XT hard fork. Meanwhile, PlanB isn’t sure if Bitcoin’s bull run has begun. Based on the S2F model, he expected Bitcoin to reach six-digit prices by 2022. However, cryptocoin.comThe market crises, which you follow from , suppressed it on a large scale.