
According to crypto analyst Akash Girimath, Bitcoin (BTC) has started a period of controlled selling. It is currently approaching short-term support levels. The analyst notes that the current bearish action has broken important levels that are likely to trigger a big sell-off in the future. That’s why investors warn them to be careful. We have prepared Akash Girimath’s Bitcoin analysis for our readers.
The BTC distribution cycle has reached its initial goal, what’s next?
Bitcoin has been in a bearish trend since it was rejected at $24,989. The volume profile between June 10 and August 19 shows that the highest trading level that was the Control Point (PoC), a key support and resistance level on the chart, has now shifted to $23,377.
This development shows a lot of capital entering the market after a short move above the 200-week SMA. But now the sellers look victorious after the 30-day Exponential Moving Average (EMA) dropped at $23,226 and the 200-day Simple Moving Average (SMA) at $22.968 alongside the PoC. This triple break is a significantly bearish development. Also, it doesn’t bode well for upcoming events.
BTC price has moved to the lower boundary of its ascending parallel channel in search of support. The volume profile shows the possibility of the price fully breaking below the channel and retesting a support area stretching from $21,300 to $20,300. The bears are likely to drop the Bitcoin price to this level before taking a short break. In terms of price action, $19,248 represents a stable support level extending to $18,608. Therefore, from a short-to-medium-term outlook, traders can expect a 15% collapse, especially if the ascending parallel channel at $22,160 is broken.
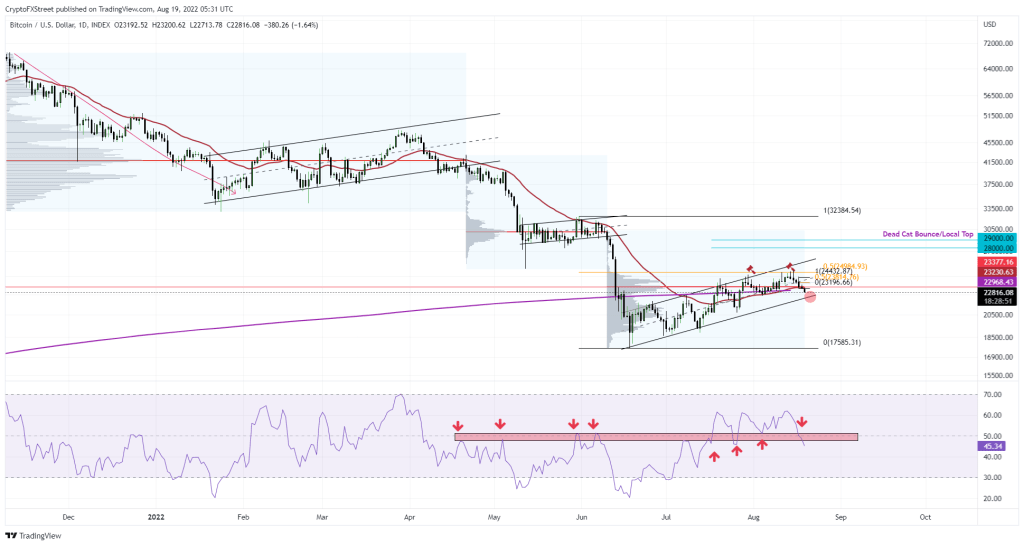 BTC 1-day chart
Things are extremely bleak for the Bitcoin price, but…
On the four-hour chart, Bitcoin price is developing final supply zones in the second leg of the distribution phase. Accordingly, it is heading towards the $22,600 and $22,382 support levels. Beyond these short-term support structures, Bitcoin will aim to fill the price inefficiency, namely the Fair Value Gap (FVG) at $21,140. It will also attempt to sweep potentially equal lows at $20,750.
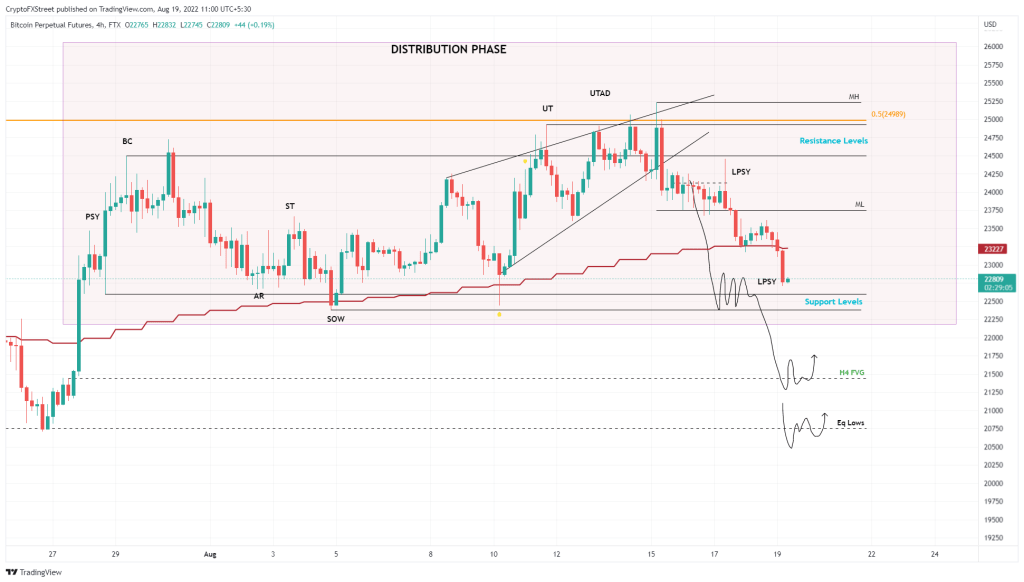 BTC 4-hour chart
Let’s take a quick look at IntoTheBlock’s Global Money In/Out (GIOM) model. It shows that 2.6 million addresses that bought roughly 1.54 million BTC are ‘Per Coin’. Roughly two days ago, these investors were in profit. So expectations were for them to soften any sales.
These addresses bought BTC at an average price of $20,366. So, it is possible that a breakout of this level could result in a steep correction to $12,000 for BTC. This technique also coincides with the predictions. Because holders are likely to throw out their losing positions.
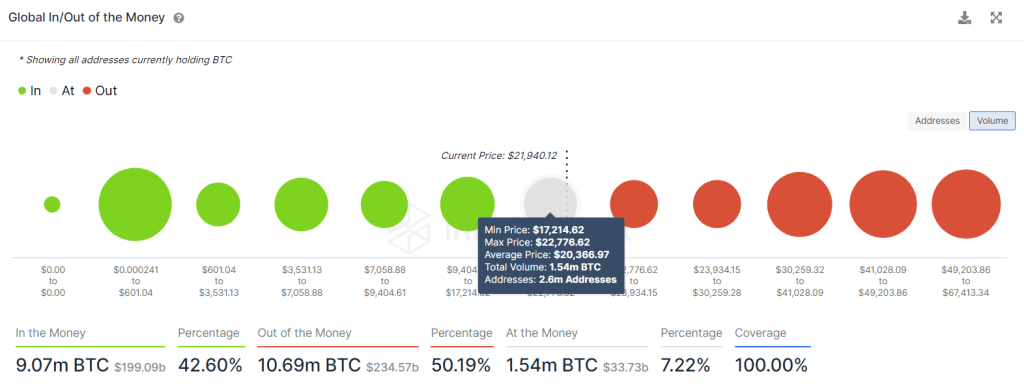 BTC GIOM
Things are extremely bleak for the Bitcoin price. However, the only way for the bulls to invalidate the bearish view is if they can turn the $25,000 hurdle into a support level. This move will give the bulls a chance to rally at a price base. It will then provide the opportunity to push BTC to a new local high between $28,000 and $29,000.