Bitcoin (BTC) price is trading below a key support level amid fear, uncertainty and doubt (FUD) plaguing market participants. The correction came after a brief rally triggered by the US Consumer Price Index (CPI) inflation data of 4.9 percent, which is 0.1 percent lower than economists had predicted on an annual basis. So what’s next? Here is the experts’ latest Bitcoin prediction
Bitcoin weekly forecast: What’s next?
On May 11, Bitcoin price lost the $27,000 support level, with a significant drop since mid-March, preventing BTC from losing all the stride it has made since the start of the year. Likewise, the price of the flagship crypto has also suffered more and more over the past month under the suppressive command of a tremendous descending trendline. With such price action, a descending triangle appeared on the one-week chart as shown below. This is a significantly bearish technical pattern, according to experts.
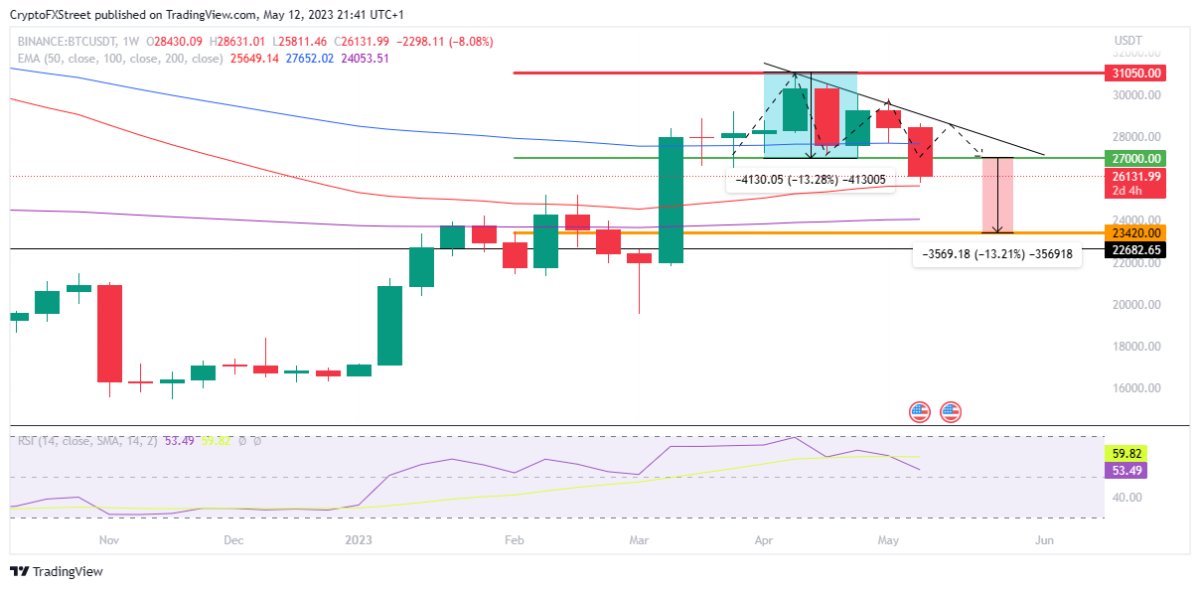
Around April 19, the bulls failed in their attempts to break through the upper border, which acted as a resistance or downtrend line. The same situation happened in early May and both attempts to break through were immature as the bulls did not have enough strength to break through the barricade. After that, Bitcoin price continues to rebound within this descending triangle as the resistance line pulls the price down. A break below the x-axis of the triangle presented as the horizontal support line will open the way for a 13.21 percent drop to $23,420, confirming the bearish outlook, and BTC will drop to 23 Jan lows around $22.682, according to analyst Lockridge Okoth.
Are there obstacles to Bitcoin’s recovery?
On the downside, the weekly chart for the BTC/USDT trading pair reveals a strong congestion zone stretching from $27,000 to $31,000. This region could further suppress the Bitcoin price, preventing the king crypto from scaling a sudden recovery.
Specifically, this region presents the 50-day Exponential Moving Average (EMA), the resistance line of the triangle, and the $30,000 psychological level. This illustrates the tense hurdles on the Bitcoin price recovery path. Also, the Relative Strength Index (RSI) showed that the bears’ control over the cryptocurrency is solid. This trend-following indicator was bearish and price strength at 34 indicated more room for further downside.
$28,000 is critical
The bearish thesis can only be invalidated if the weekly candlestick makes a decisive close above the resistance line of the triangle at $28,000. However, a rebound above the $27,000 level would signal an aggressive bullish effort to defend against further losses. Such a move would increase the chances of Bitcoin price surging towards the $31,050 resistance level and would represent a 15 percent rise from the current level.

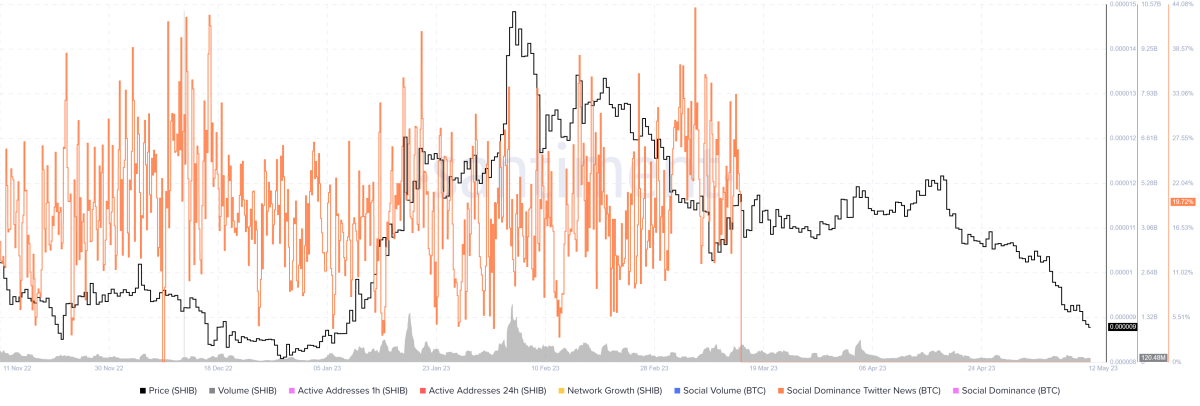
Santiment’s data shows that the drop in Bitcoin price coincided with a time when the general sentiment among market players was falling on social media platforms. As the chart above shows, the social dominance/Twitter news metric has dropped almost 20 percent. As Bitcoin price drops below the $27,000 support level, investors’ sentiment for crypto king on all social media platforms remains negative.
However, Brian Quinlivan, on-chain analyst and marketing manager at Santiment, believes that the current Bitcoin price correction provides an opportunity for investors to buy BTC at low rates. Bitcoin price has recorded losses of up to 10 percent over the past month, while Ethereum (ETH) price has also recorded similar declines to the other 10 non-stablecoin cryptocurrencies on the CoinMarketCap list. This represents one of the largest 30-day declines since June 2022 and was driven by the Fed’s rate hikes as well as changing regional and global macroeconomic conditions.

Bitcoin prediction from Fidelity official: Bitcoin rally accelerated too much
On the other hand, Jurrien Timmer, Fidelity’s global macro director, recently commented on the state of Bitcoin, comparing the current market dynamics with those of gold. Timmer suggests that Bitcoin is currently on the same rhythm as gold, but warns that the leading cryptocurrency may have moved on a bit, pointing to potential overvaluation at the $30,000 mark. In his analysis, Timmer highlighted an 88 percent inverse correlation between Bitcoin and the two-year real TIPS return, and a 63 percent inverse correlation with the PCE-derived real rate.
This correlation analysis, based on data from 2018, places Bitcoin in a similar position to gold in terms of its response to real exchange rate factors. What Timmer is suggesting here is that Bitcoin price tends to move in the opposite direction of these two economic indicators. According to the expert, if the yields of certain government bonds increase or inflation rises, we can expect the Bitcoin price to decrease overall.