Gold prices hit a five-month high on Monday as the dollar slumped after more Chinese cities loosened Covid-19 restrictions over the weekend. However, later in the day, it turned south and declined to $1,790 levels. Analysts interpret the market and evaluate the technical outlook of gold.
For now, developments seem to be in favor of gold prices.
Spot gold entered the red zone after hitting $1,809.04 on the day. At the time of writing, it was trading at $1,791, down 0.3%. U.S. gold futures slid 0.1% to $1,807. The dollar index fell 0.3 percent to a five-month low. The weaker dollar makes dollar-priced bullion cheaper for offshore buyers. Citing strong employment data, City Index analyst Matt Simpson makes the following assessment:
The market is still waiting for the Fed, which provides support to gold, to slow down the tightening pace. Also, the fact that China is reducing the Covid restrictions means that the demand for gold in the region will increase. It is possible to say that this will further support gold prices.
cryptocoin.com As you follow, data released on Friday showed that US employers hired more workers than expected in November and increased wages. This, in turn, led to the escalation of recession concerns. However, these data probably won’t stop the Fed from slowing the pace of rate hikes from this month. The market sees a 91% chance for a 50bps rate hike at the Fed’s meeting this month.

Important levels to watch for gold price
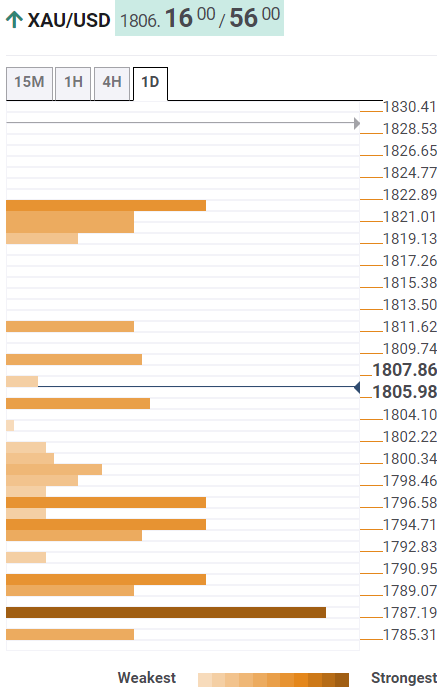
Market analyst Dhwani Mehta looks at the Technical Confluence Detector (TCD) for a technical view of gold, noting the following levels. TCD shows that gold price is now trying to recapture the one-day R1 pivot point at $1,808. A sustained move above the latter will threaten the Bollinger Band one-day Upper Level at $1,812. Acceptance above the latter will feed a fresh rise towards the convergence of the one-week R1 pivot point and the one-day Fibonacci 161.8% at $1,822.
Alternatively, close support stands at $1,805, the previous day’s high. It will also challenge the previous four-hour high of $1,799 below that. SMA200, at $1,797 for one day, will be the next downside target. Also, breaking the last one will open the Fibonacci 61.8% for one day at $1,794. For gold buyers, the line in the sand holds $1,790 at one-week Fibonacci 23.6%.

“Yellow metal greenlights extra gains in the near term”
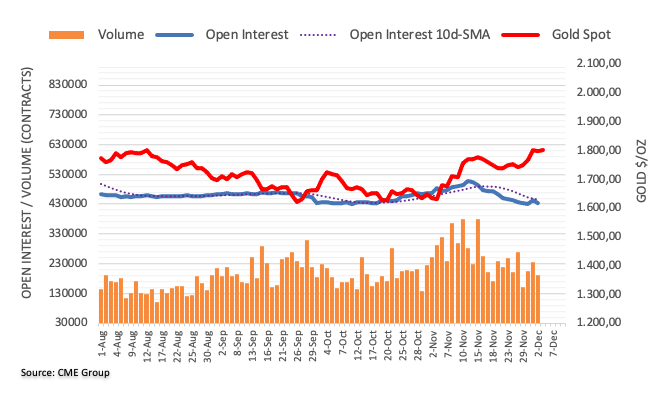
Open interest in gold futures markets contracted by about 7,000 contracts over the weekend, according to preliminary data from CME Group. Thus, it partially reversed the previous structure. Volume followed suit. Accordingly, approximately 43.6 thousand contracts increased after two consecutive days of pullbacks.

Gold prices closed Friday’s session with modest losses after rising sharply in previous sessions. But, according to Market analyst Pablo Piovano, the corrective decline came after declining shorts and volume. The analyst says that this also distracts gold from further losses. He also notes that instead, it opens the door to the continuation of the uptrend. The next target for the yellow metal stands at $1,879 (June 13), the June high.


