
As we reported
Kriptokoin.com, Ethereum (ETH) continues to keep up with the bearish momentum in the markets. The leading altcoin has lost about 10 percent of its value in the past week. The bears’ hand strengthened in the market, where buyers left with fear and panic.
ETH needs to break above this key level to breathe easy
Ethereum technical outlook continued its downtrend and selling pressure increased. ETH has also witnessed a steady sell-off in the past 48 hours. Ethereum also dropped below the long-standing support line of $1900. The bearish price action of the altcoin, which has been trying to recover from the decline in the last 24 hours, is still strong now. The bears may be pressing to push ETH’s price below the $1700 level. A drop below the $1700 price level will cause ETH to drop another 19 percent. ETH needs to trade above the $1900 level again for the bulls to breathe.
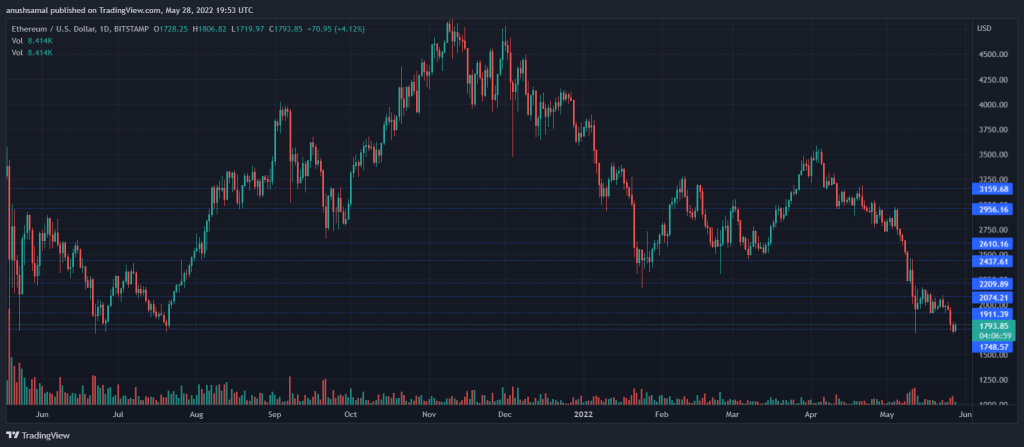
The altcoin has not traded near its current price level for almost a year. The altcoin’s overall resistance remains at $1900, ETH must attempt to trade above $2200 for bearish pressure to be invalidated. Local support for the leading altcoin is at $1700 if bears continue to drive price action. Ethereum volume has decreased and is seen in green. This showed the positivity on the chart.
Ethereum Technical Analysis
Ethereum registered an increase in purchasing power on the one-day chart and was trading very close to the immediate support level. Also, ETH was trading below the 20-SMA line, meaning the selling momentum is active and strong. Accordingly, it meant that sellers were responsible for price momentum. Likewise, the Relative Strength Index was below the half-line. This meant that there was less purchasing power in the market. However, it can be noted that there is an increase in the RSI which could be a sign that purchasing power is gaining momentum. The possibility of a reversal cannot be ruled out as there is a bullish divergence on the chart (yellow). A bullish divergence is about a trend reversal.
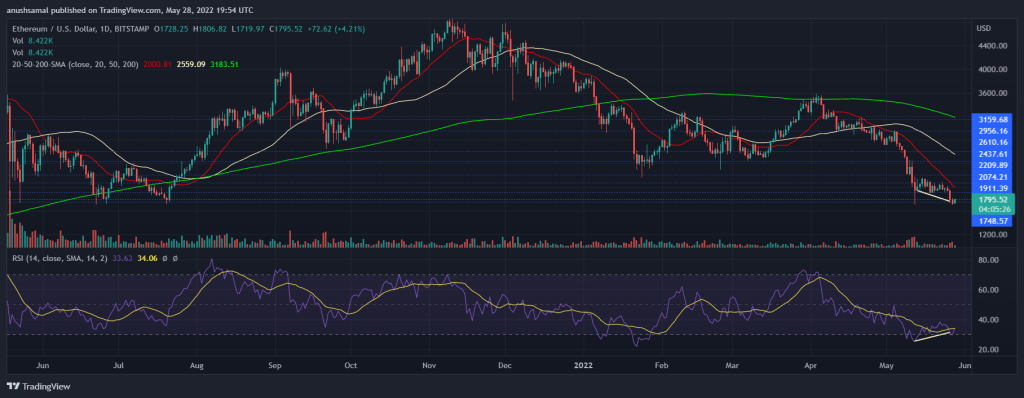
Ethereum continued to give sell signals on the one-day chart. The oscillator was still negative on the one-day chart. The indicator is supposed to show price momentum, red histograms show negative price action. Red histograms also show a sell signal on the chart. The Movement Index also decides the overall price action and showed that the -DI is above the +DI level. The Average Directional Index (Red) was above the 40 mark, which means that the current market trend is strong and the decline may continue in the next trading sessions.


