Gold prices struggled to stay above the $2,000 level on Monday, unaffected by the previous session’s correction as investors assess the Fed’s rate hike trajectory.
The smoothing did not affect the positive trend for gold prices
Gold prices fell 2% on Friday after the dollar bounced and Fed officials signaled the need for another rate hike. The new week started with a horizontal course. Spot gold was down 0.2% to trade just over $2,000 at press time. U.S. gold futures were down 0.15% to $2,012.00.
Carlo Alberto De Casa, external analyst at Kinesis Money, says Friday’s price correction did not affect the positive trend for gold. From this point of view, the analyst adds that the $1,980-2,000 region is a promising support for the shiny metal despite the profit taking.

Gold maintains strong correlation with real returns
Meanwhile, it should be noted that Fed Governor Christopher Waller and Atlanta Fed President Raphael Bostic have suggested that the Fed may raise rates by another 25 basis points (bp) next month. Also, the CME FedWatch tool shows that markets are pricing in an 84% probability of a 25bps increase in May. On the other hand, comments from European Central Bank (ECB) officials, including President Christine Lagarde, will be on investors’ radar this week, along with speeches from New York Fed President John Williams and Cleveland Fed President Loretta Mester.
cryptocoin.com As you follow, the US producer price index (PPI) recorded the highest decline in nearly three years last month, coming one day after inflation data pointed to moderation in consumer prices. Rising interest rates reduce the attractiveness of non-yielding bullion. The dollar index, which capped gold’s upward momentum, rose 0.1%, making bullion more expensive for offshore buyers, and benchmark Treasury yields hit a two-week high. Standard Chartered analyst Suki Cooper comments in a note:
Gold also maintains a strong correlation with real returns, and price action remains sensitive to US inflation and employment data.

Gold prices technical analysis: Pullback expected
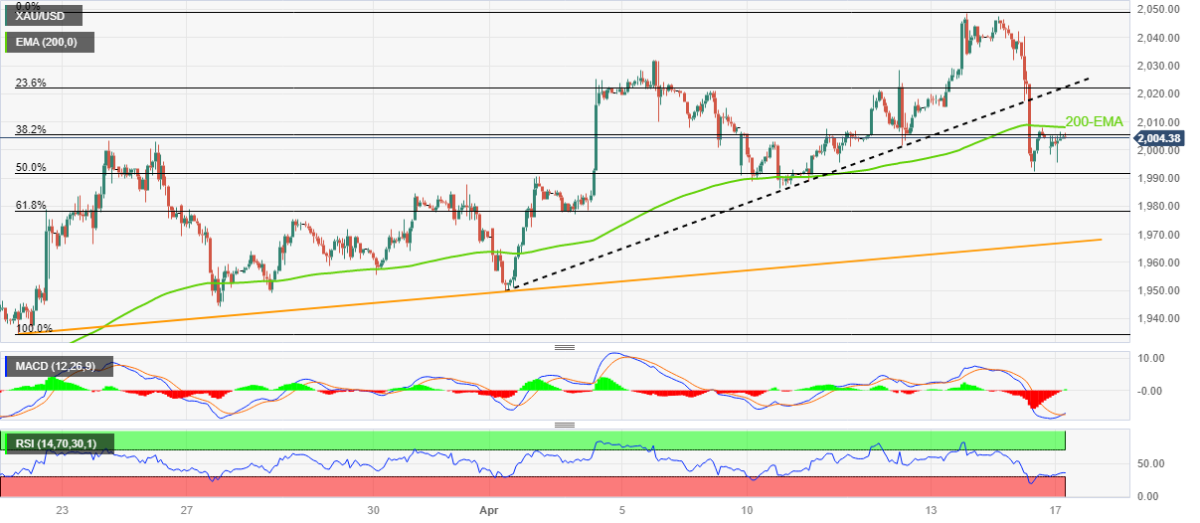
Technical analyst Anil Panchal draws attention to the following levels in the technical outlook of gold. Gold price bounced off the 50% Fibonacci retracement level of gold from March 22 to April 13 to approach $1,991 while consolidating the previous day’s downside break of the two-week support line and now holding resistance around $2,020. The RSI (14) rebound from the oversold zone and the upcoming ‘bullish cross’ on the MACD indicator are adding strength to the recovery moves.
However, the 200-bar Exponential Moving Average (EMA), which is around $2,010 at press time, is maintaining the immediate upside for gold price ahead of the above-mentioned resistance turning into support around $2,020. Following that, the early month high swing around $2,033 and the monthly top around $2,049 could tempt gold bulls.
Meanwhile, a downside break from the 50% Fibonacci retracement level of $1,991 will need confirmation from the 61.8% Fibonacci retracement and three-week ascending support line near $1,978 and $1,967, respectively, to entice the golden bears. Overall, the gold price is struggling for clear directions but buyers seem to be running out of fuel lately.
 gold hour chart