With an increase of almost 60 percent in four days, will Injective Protocol (INJ) continue to make a name for itself in the crypto market?
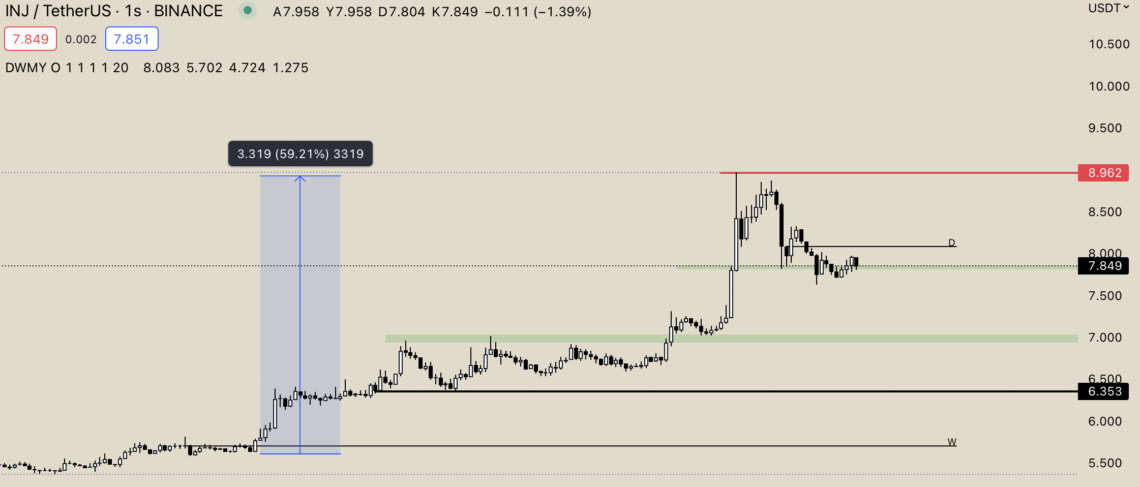
In light of Bitcoin’s hold above $30,000, huge rises have been observed in many altcoins. Among these altcoins, INJ was the most prominent.Approximately INJ, which experienced an increase of 59.21 percent in three of the four days really feels bull. Will the altcoin, which tried the $ 8.96 levels as of yesterday, continue to delight its investors? We have compiled a chart analysis of INJ, one of the coins that have experienced the strongest bull market.
Injective Protocol (INJ) Graphical Analysis
Reaching the levels of $ 8.96 with the enthusiasm it created from the monthly opening price. INJ, In a short time, it added a value close to 60 percent. . Exceeding the $ 7 levels, in particular, paved the way for sharp rises. Looking at the current chart, the INJ side In order for the upwards to continue, the $ 8.96 level is exceededis of great importance. Stronger bull sounds will be heard on the INJ side from exceeding this level . In decline scenarios, Maintaining the $ 7.84 – $ 7.00 and $ 6.35 levels is critical.