
While the crypto market has been relatively stable over the weekend, these 3 altcoins have increased significantly. Crypto analyst Valdrin Tahiri states that in these moves, the prices of all 3 altcoins have exceeded important resistance levels. The analyst determines the route that these coins will follow from now on.
This altcoin leads the winners: Featch.AI (FET)
FET price has rallied along an ascending support line since June 10. This line has been confirmed multiple times, most recently on August 17 and 22 (green icons). The latter formed a higher bottom and accelerated the rate of increase. On September 2, FET price broke above the $0.25 horizontal resistance area and closed. Now the expectations are for this area to provide support.
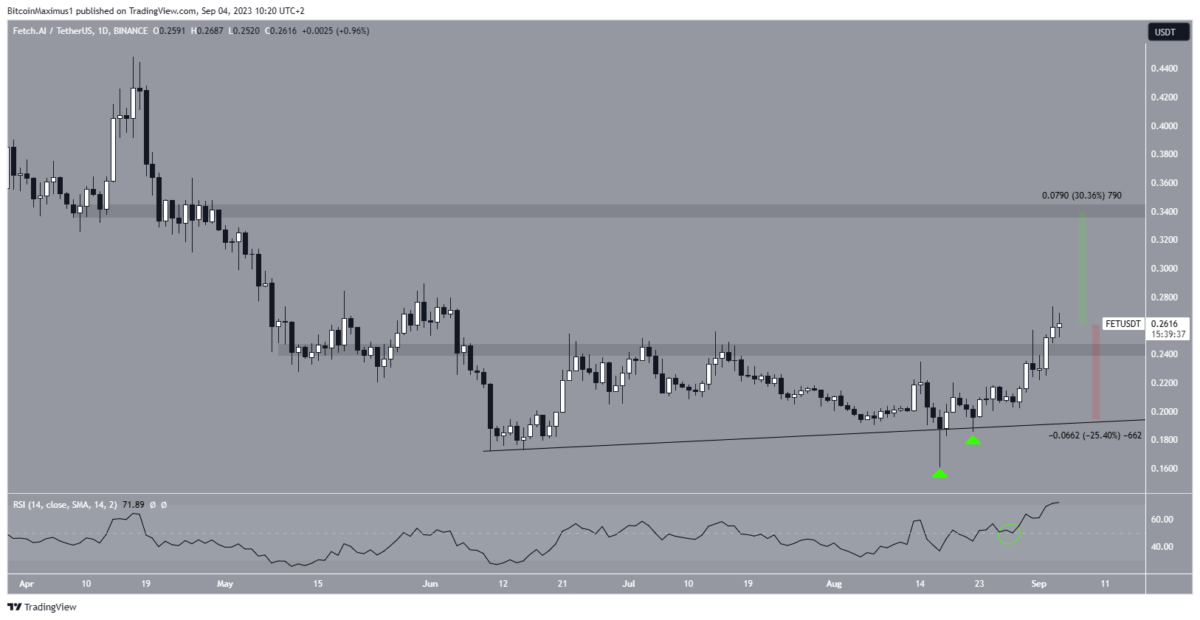 FET Daily Chart. Source: TradingView
Meanwhile, the RSI supports the breakout. With the RSI as a momentum indicator, traders determine whether a market is overbought or oversold. Thus, he decides whether it is appropriate to save or sell an asset. If the RSI is above 50 and the trend is up, the bulls have an advantage. However, if the value is below 50, the reverse is true. The indicator is above 50 and increasing (green circle). So, both are signs of an uptrend.
If the FET continues to rise, it is possible to reach the next resistance at $0.34. This means that the altcoin price is making an upward move of 30%. On the other hand, on a close below $0.25, this prediction becomes invalid. If this happens, a 25% drop to the ascending support line at $0.20 is likely. This will be the future price scenario.
XLM price breaks after bounce
The altcoin price has been bearish since July 13, following a descending resistance line. This decline was as low as $0.105 on August 17. The price then bounced back, confirming the $0.110 horizontal support area. So it created a long bottom wick (green icon) which is considered a sign of buying pressure. XLM broke out of the resistance line two days after forming a higher low on Sept. As the line has been in place for 52 days, the break of the line was expected to initiate a significant rise. However, despite the breakout, the price is still trading below the main $0.130 resistance.
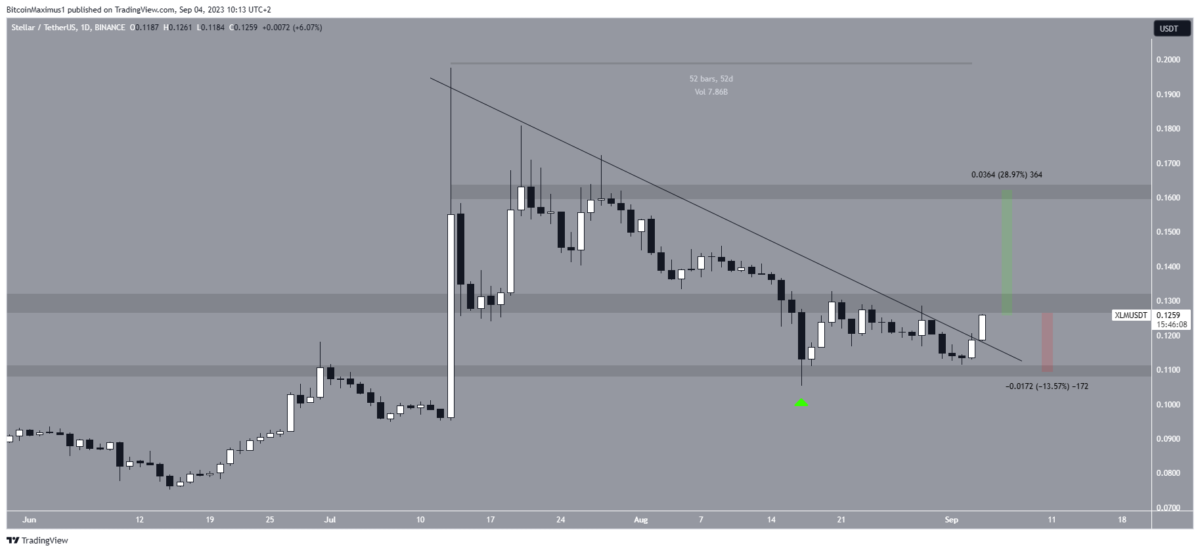 XLM Daily Chart. Source: TradingView
If altcoin price retraces the $0.130 zone, a 30% increase is possible. Thus, it is likely to reach the next resistance at $0.160. On the other hand, a rejection from the zone could catalyze a drop to the resistance line, which coincides with the horizontal support area of $0.110. This would mean a decrease of about 15%.
This altcoin aims to break through resistance: Bluzelle (BLZ)
cryptocoin.com As you follow, BLZ price has increased since it formed a higher low on August 7. Initially, the price failed to climb above the $0.125 horizontal resistance area. Rather, it was rejected. Thus, it formed a long upper wick (red icon) and fell below the field. However, a push over the weekend pushed the altcoin price above the $0.125 area. It is possible for the area to provide support if it closes above the price.
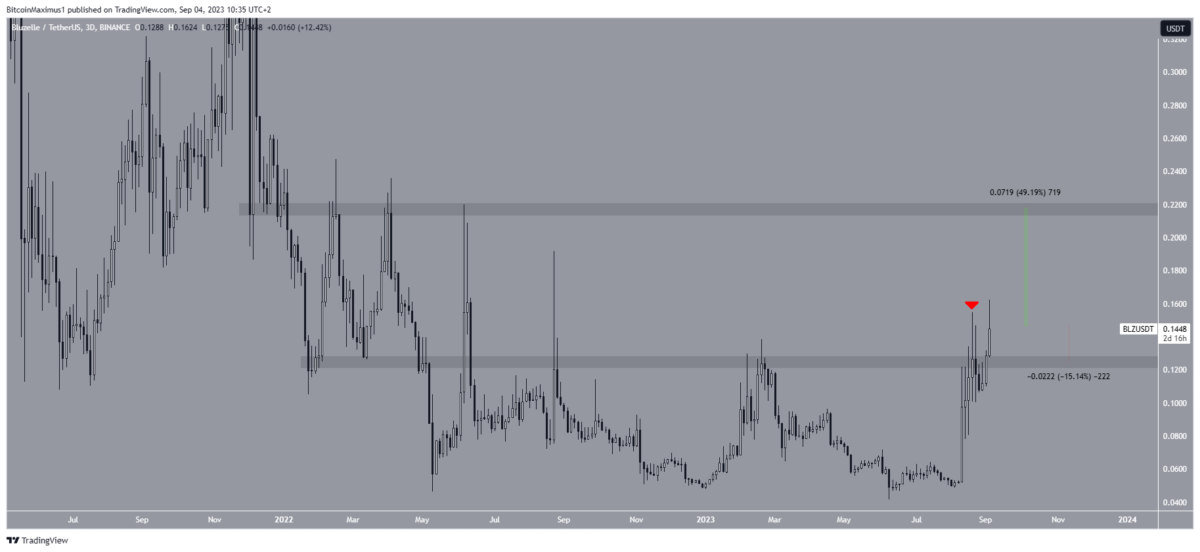 BLZ 3-Day Chart. Source: TradingView
If the upside continues, the BLZ is likely to increase by another 50%. Thus, it is likely to reach the $0.22 resistance area. On the other hand, in case of a loss of momentum, a 15% drop to the $0.125 region is possible.


