
Crypto analyst Akash Girimath considers DOGE’s 50% move. Also, according to the analyst, the Shiba Inu price is poised for a 20% rise. The analyst says that the XRP price reveals the big picture plans of the Ripple bulls. Finally, the analyst notes that the SOL price is preparing to skyrocket to $40. We have compiled the analyst’s analysis for altcoins for our readers.
There may be a rally on the horizon for these altcoins!
DOGE plans its next move
Dogecoin price has formed a W or double bottom, which predicts a bullish outlook for DOGE holders under certain conditions. For DOGE, this technical formation includes two distinct bottoms that occurred between May 7 and April 23. Three swing highs of these tops can be connected using a horizontal trendline to form a neckline at $0.1277.
A three-day candlestick close above this level would confirm DOGE’s breakout from the W pattern. In such a case, the double-bottom setup predicts a 48% rise to $0.1898, with the distance between the second peak and the valley added to the $0.1277 breakout point. However, DOGE will need to face and overcome the $0.0965 hurdle to start the bigger outlook. DOGE is likely to stop rallying beyond $0.1277 around another critical resistance level of $0.1624.
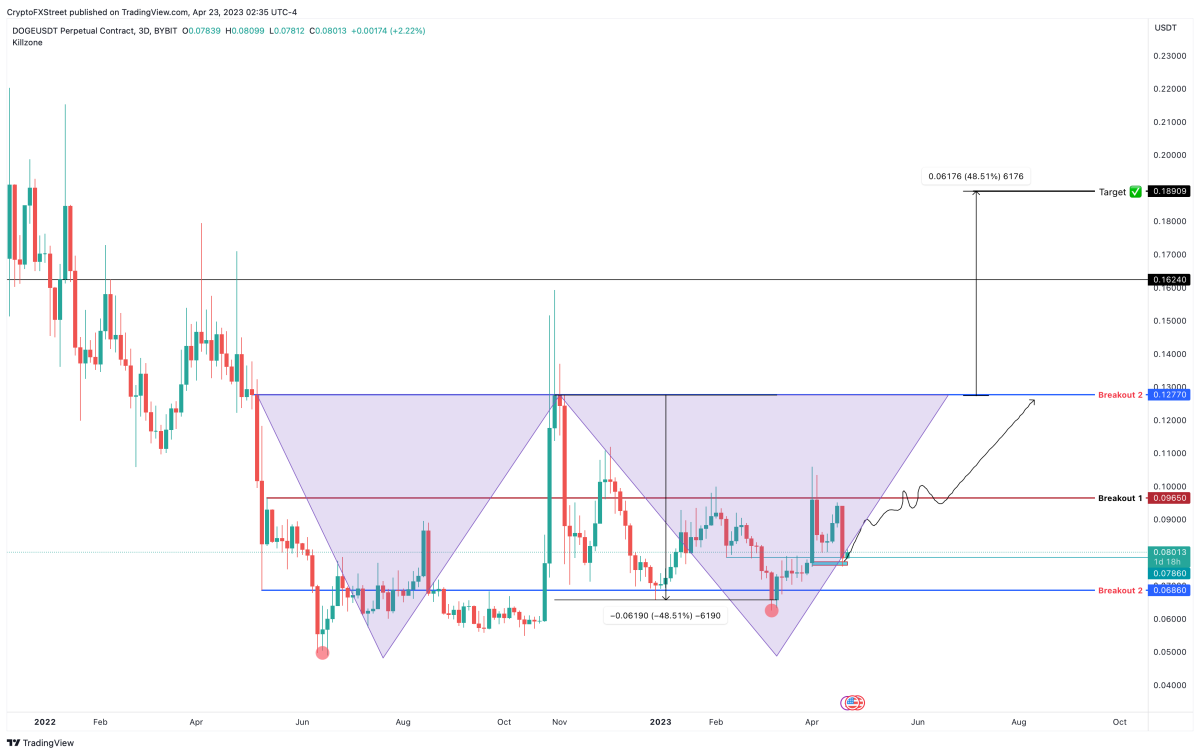 DOGE 3-day chart
Among altcoins, Dogecoin is ready for an uptrend. However, it is possible that a drop in Bitcoin price could negatively impact this setup for DOGE. In such a case, a break of the $0.0686 level will create a lower low. Hence, it will invalidate the ascension thesis. Due to this development, Dogecoin is likely to revisit the $0.0686 support base.
Shiba Inu price ready to rise
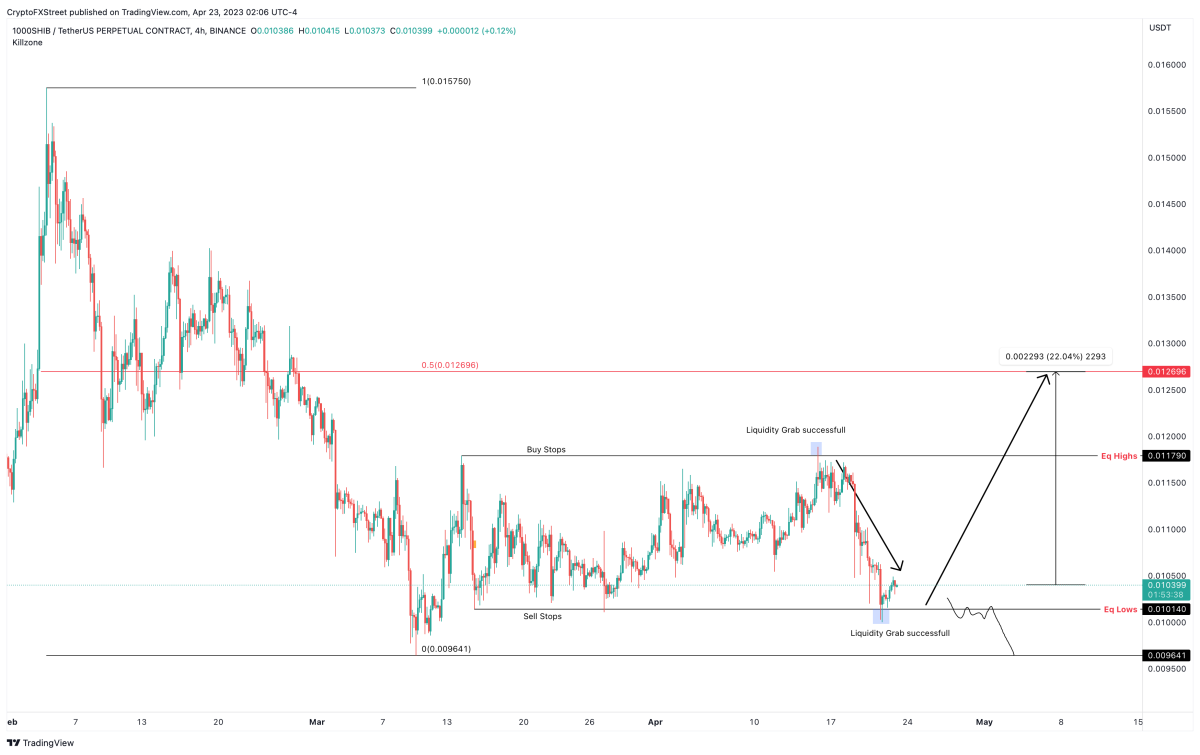
cryptocoin.com SHIB hit a local top of $0.0000157 on Feb. However, over the next four weeks, it lost nearly 38% in value. This downtrend formed a bottom at $0.00000964 on March 10. Since then, SHIB has remained in a consolidation. This newly formed range extends from $0.0000101 to $0.0000117.
Careful observation reveals that liquidity movements are triggers for a volatile move. For example, the high range of $0.0000101 swept on April 15. This was followed by multiple four-hour candlestick closes below the $0.000117 level. This buy-stop liquidity grab catalyzed a 14% drop. While SHIB declined, it swept the $0.0000101 level. Thus, as of this writing, it has rallied around 4%. If history repeats itself, it is possible for SHIB to retest the high range with $0.0000117.
However, if buying pressure builds and continues, SHIB among altcoins is likely to go higher. In this case, it is likely to retest the $0.0000126 level, which is the midpoint of the 38% collapse between February 4 and March 10. This move represents a 22% rise from the current level.
 SHIB 4-hour chart
While the rally makes sense, things are likely to go wrong if SHIB fails to show this bullish momentum. If the SHIB closes a stable four-hour candlestick below $0.0000101 and turns it into a resistance level, it will invalidate the bullish thesis. In such a case, SHIB is likely to revisit the low of the aforementioned 38% collapse at $0.0000096.
XRP price ready to take control
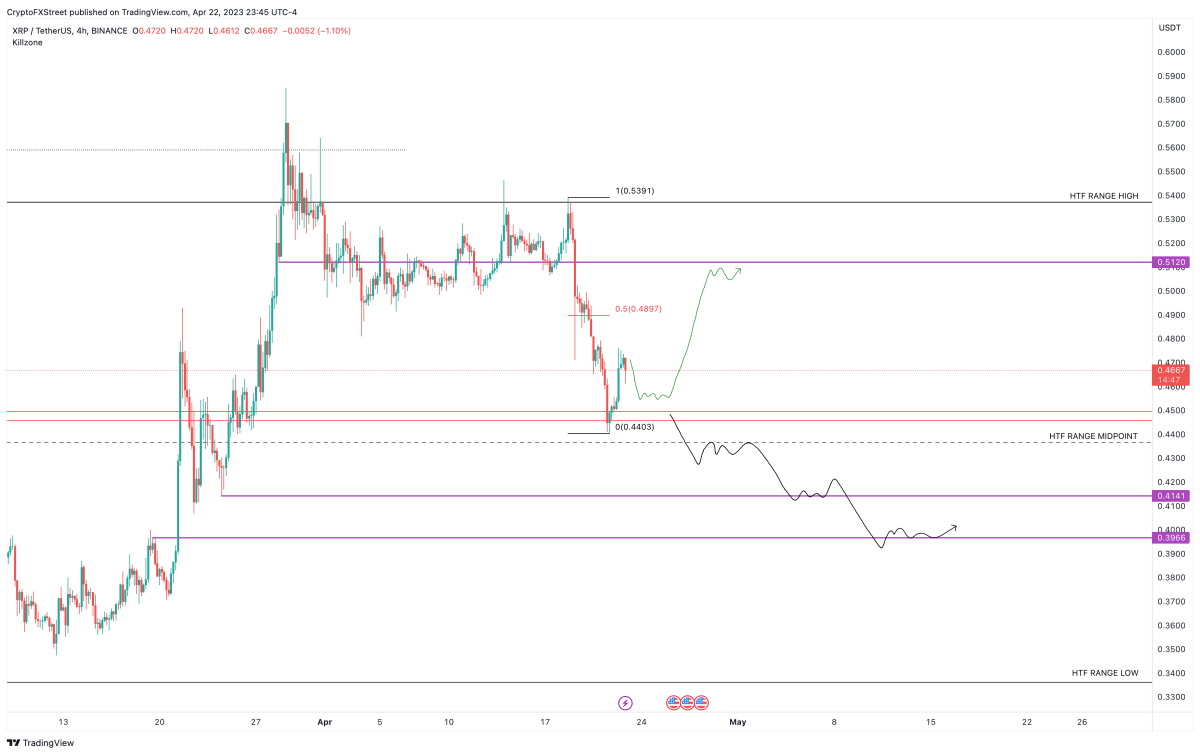
The altcoin has bounced around 8% after the last 18% drop from April 18-21. This move shows that the bears are slowly giving up control. After a minor pullback, this recovery rally is likely to extend to $0.489, the midpoint of the 18% decline. In some cases, it is possible for Ripple bulls to continue their rise and tag the $0.512 hurdle. This is a short-term outlook for XRP. It is also likely to provide some good opportunities to day traders.
However, if XRP manages to break through the $0.537 hurdle, it will mark a breakout from a major higher timeframe level. In such a situation, traders need to focus on the three-day chart of the XRP price.
 XRP 4-hour chart
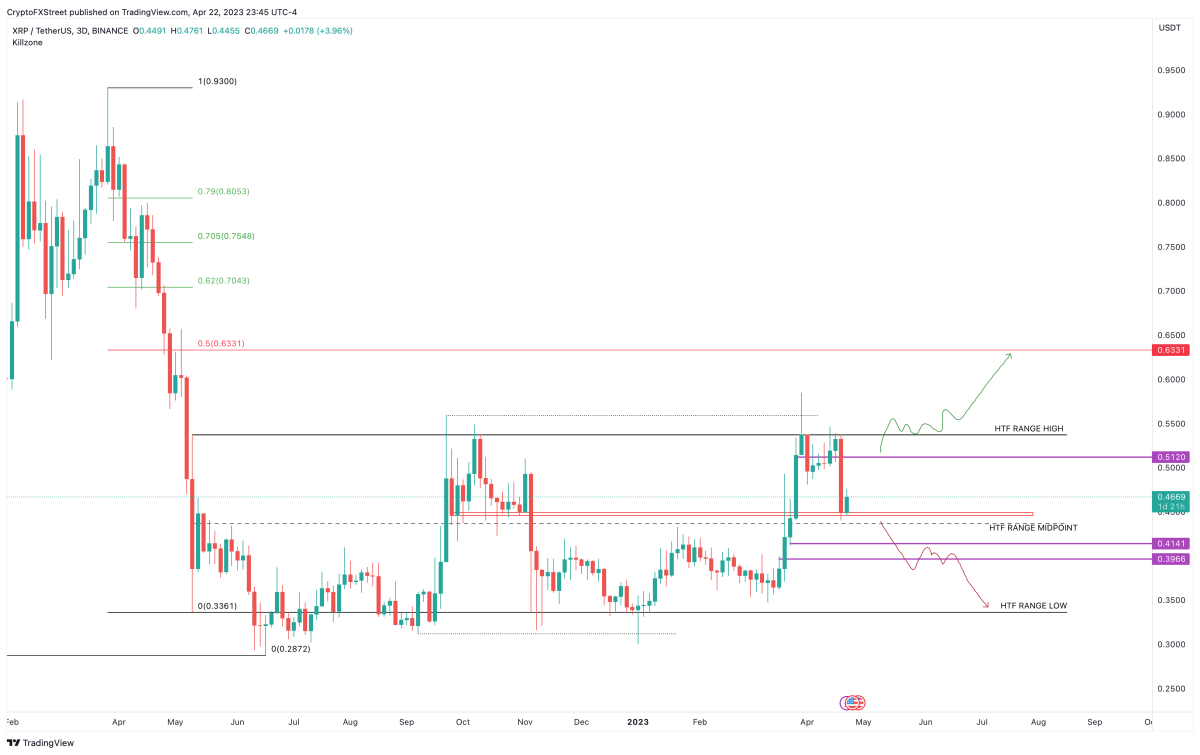
The three-day chart shows that the XRP price has been hovering in the $0.537 to $0.336 range for about a year. If XRP surpasses this range on the upside, it will trigger a massive bullish reaction. In such a case, it is possible for XRP to retest the $0.633 level, which is the midpoint of the 69% collapse witnessed between March 26, 2022 and June 18, 2022. This move will mean a 35% gain. However, an extension up to the $0.704 barrier will yield a 50% gain for holders.
 XRP 3-day chart
A break of the midpoint of the range at $0.436 is the first sign of weakness in the buyers camp. However, the bullish thesis will be invalidated if XRP breaks the $0.414 and $0.396 levels. Also, it would potentially trigger a collapse from the $0.336 low.