According to analysts, the Shiba Inu price points to another sharp rise. It could be a weekend rally. SHIB price points to an alternative bullish number based on newly discovered techniques. Meanwhile, traders should pay attention to the multiple scenarios that will be played over the weekend. Here are the details…
Shiba Inu (SHIB) price can be volatile
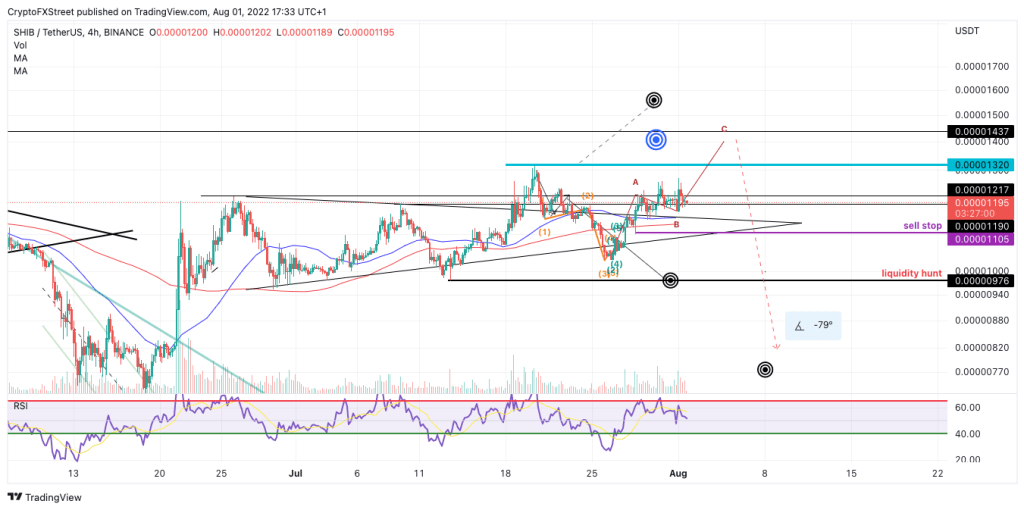
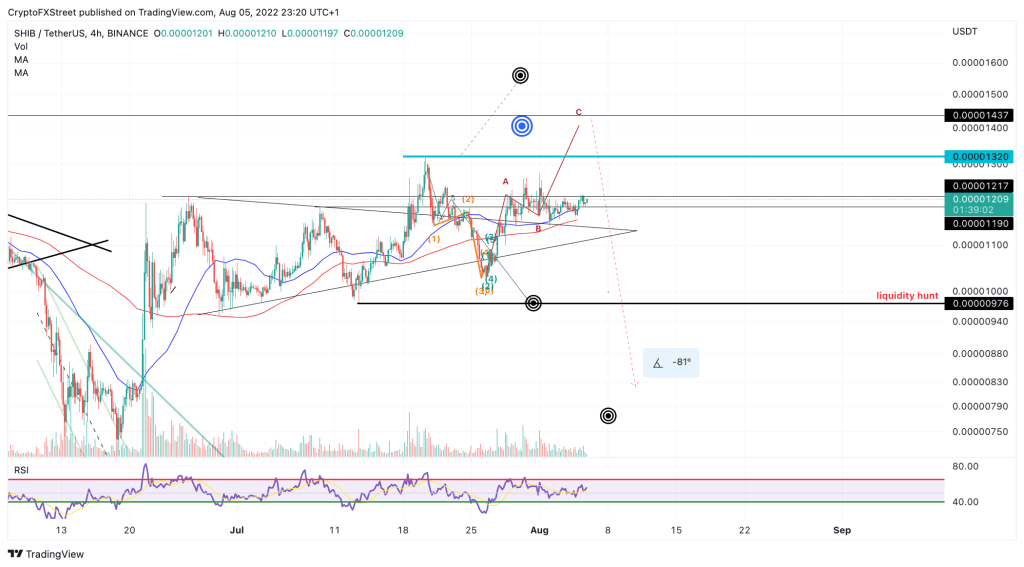
Shiba Inu price is showing subtle signs to confirm a recently established uptrend, according to analyst Tony M. New formations found higher than $0.00001217 could be early evidence of a starting price increase towards $0.000014000. According to the analyst, SHIB price may witness extreme volatility, which could lead to a FOMO-style price pursuit. Therefore, traders should start generating alerts and anticipating a trading plan. A second attempt at $0.00001220 could be the catalyst that bullish traders are looking for. An invalidation of the sudden bullish rally could signal a break below $0.00001100.
Shiba Inu price has been moving in a very bullish triangle consolidation this summer. The bullish targets were expected to reach $0.00001700.
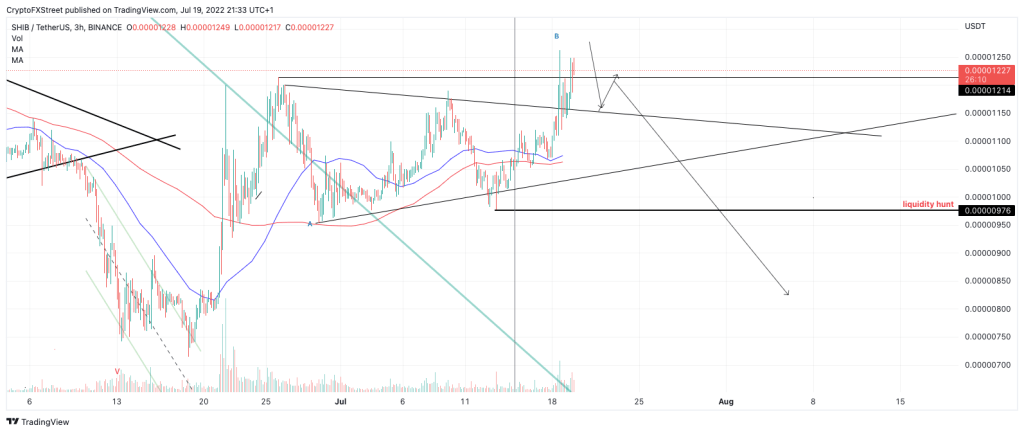
Is there a “bear trap” for the Shiba Inu?
According to the analyst, the Shiba Inu’s failure to show bullish price action has prompted clever ideas of money traps at play. In mid-July, the bearish forecast was published, targeting the liquidity level of $0.00000975. Shiba Inu price fell 27 percent to $0.00001033 amid the latest bearish forecast posted last week. The meme coin fell 5% before reaching the targeted liquidity level of $0.00000975 and has since taken about 80% of the predicted decline above the initial triangle trendline. The price is causing justified confusion among crypto traders.
What’s next?
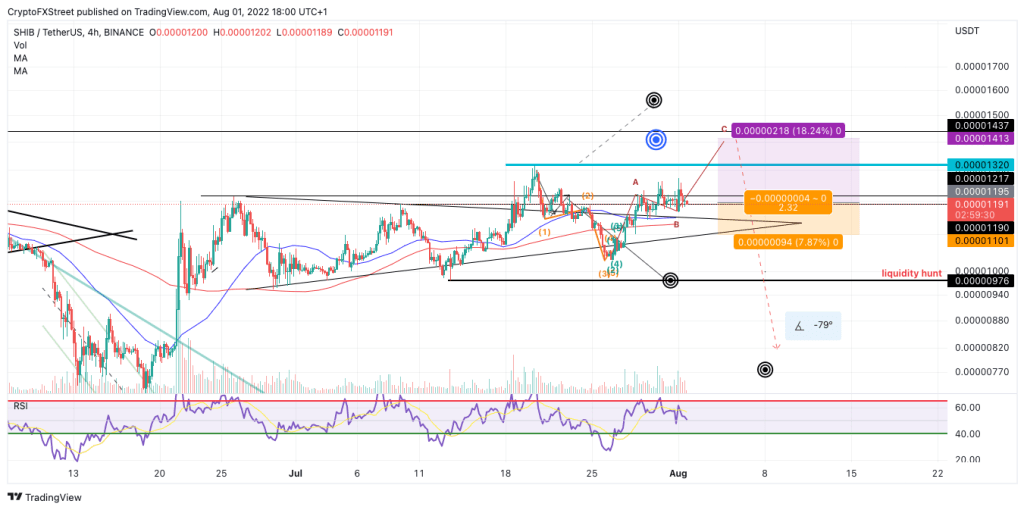
Now there is a new scenario on the cards, aiming for new highs at $0.000014000. A break above $0.00001270 should be the catalyst to trigger such a move. However, summer highs can be seen with bearish targets at $0.00000770. Traders should be cautious as a liquidity hunt may begin soon after that.
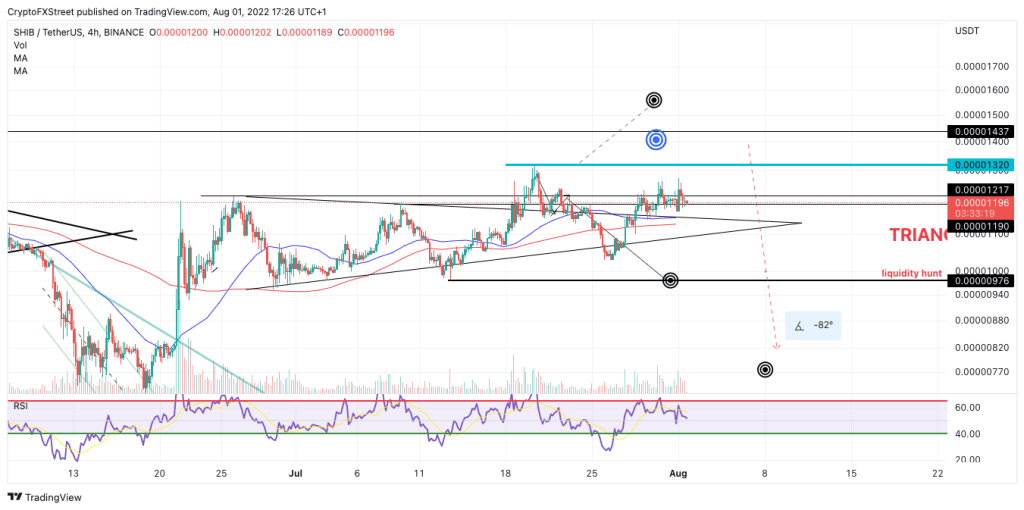
Also, the technical data suggests that higher targets may come true first. However, it is worth noting that a break below $0.00001100 could trigger a sell towards the $0.000000970 levels in the short term, according to Tony M. Multiple trade setups can be predicted while this thesis is properly studied. Traders should pay attention to the multiple scenarios in the game.
