The cryptocurrency market has recently entered a period of remarkable silence, reaching all-time lows of volatility. The daily trading price range is in a narrow band of 5%.
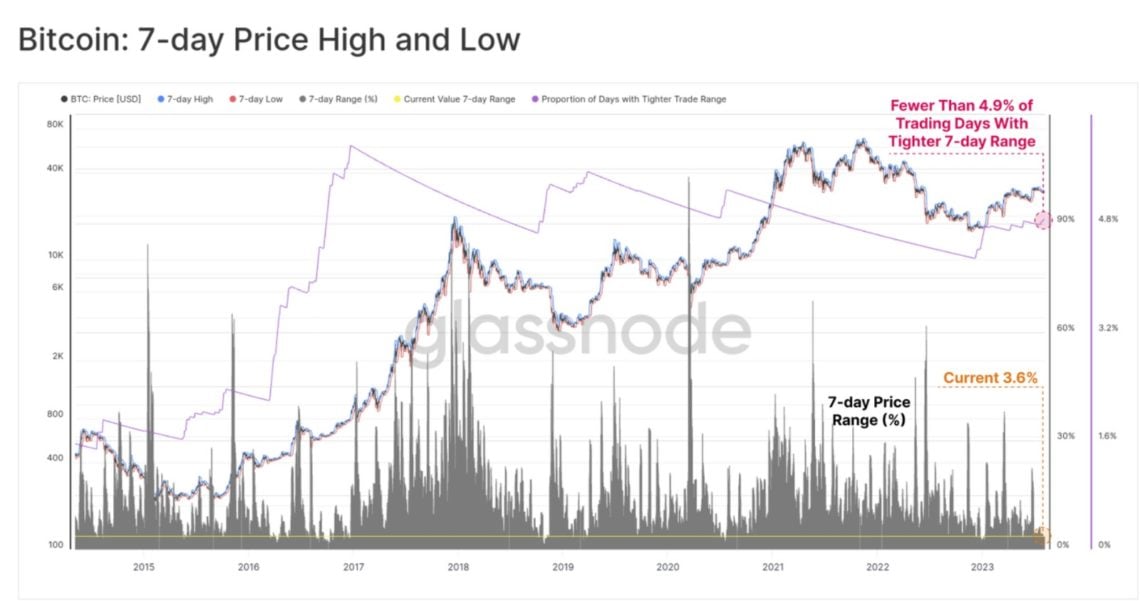
However, the possibility that this quiet period may return with high volume and volatile movements in the future should not be ignored. In this respect, it would be useful to focus on establishing our strategy by taking a look at the support of both technical and long/short-term investors on the onchain side.
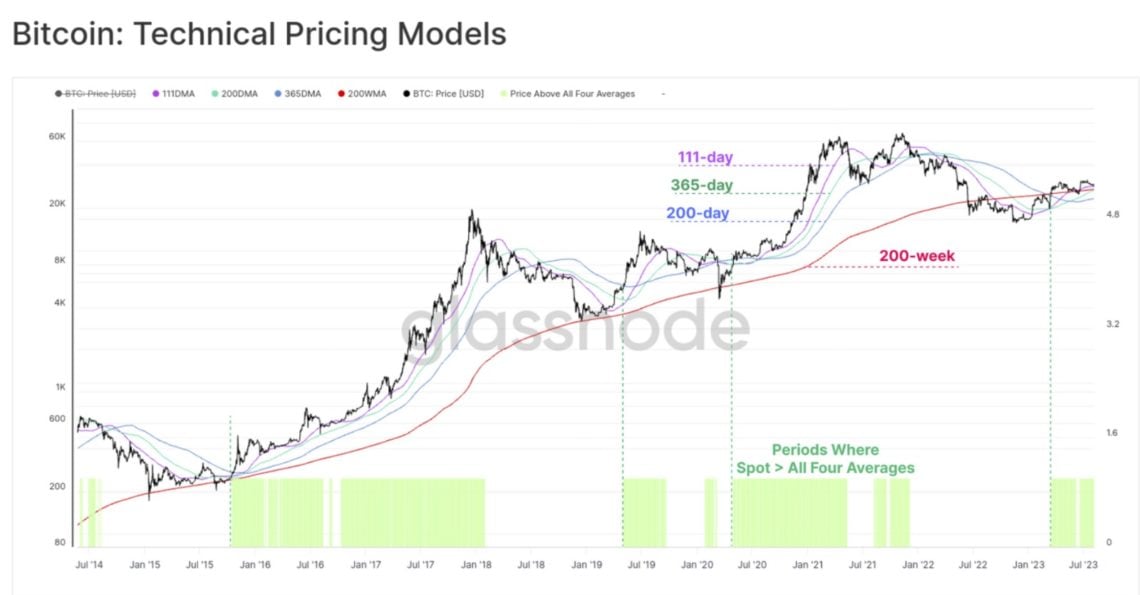
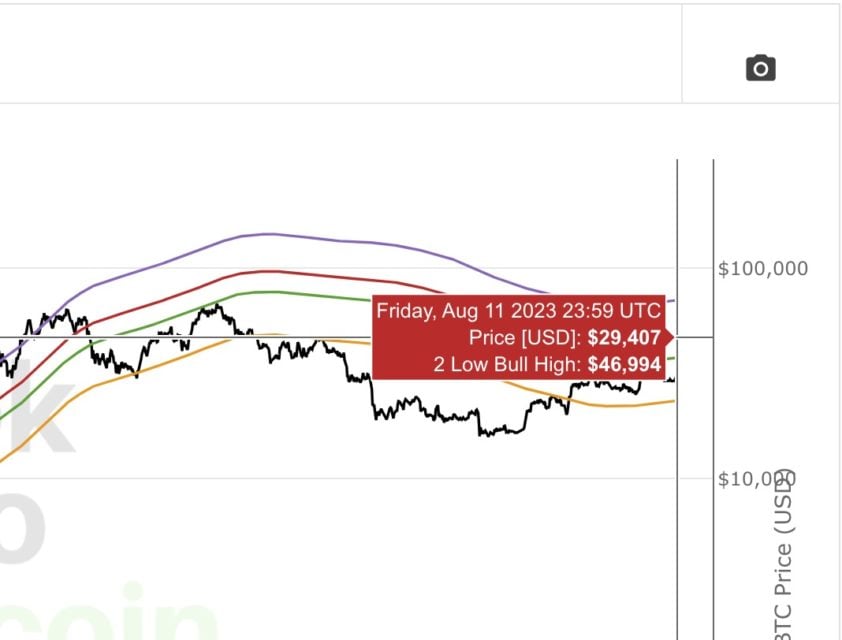
Our long term technical supports are onchain side, 111DMA, 200DMA, 350DMA and 200WMA. The lowest and highest band of these important supports are between 23.3K (200DMA) and 28.5K (111DMA).
If bitcoin price fails to hold above $28,500, it is likely to test $23,300 from these long-term technical supports.
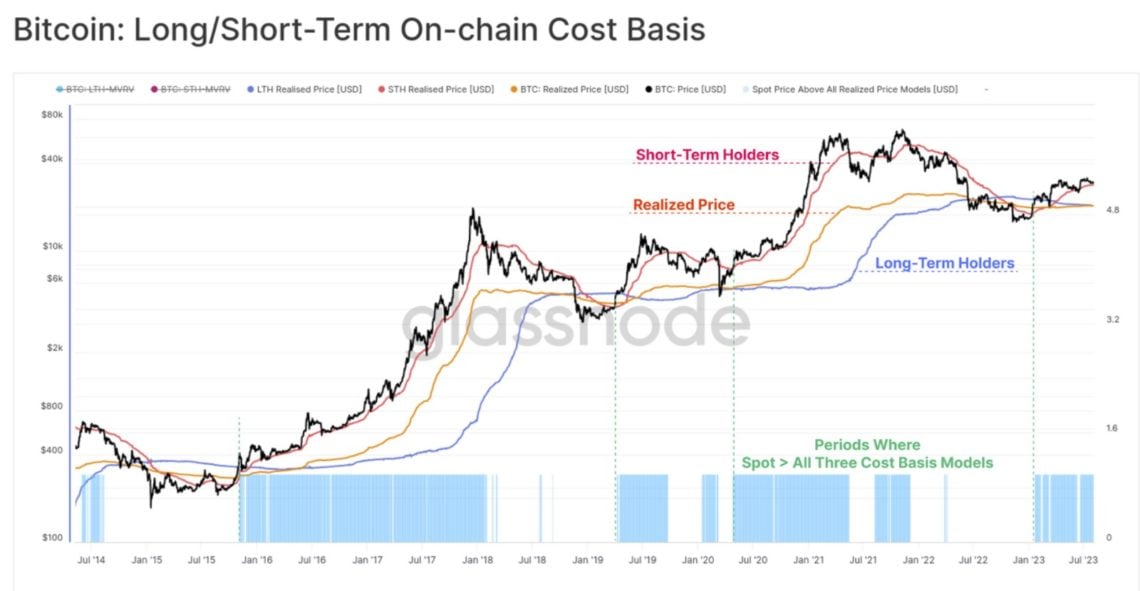
In addition, the realized prices of short-term and long-term investors are also very important as a support. At the moment, it is seen that we have received support from the realized prices of the short term buyers. This may indicate that short traders are positively evaluating current price levels and that price is trying to hold on to these levels. However, if this support level is lost, the realized price will be a critical support at $20,350.
All in all, a period of low volatility and price action that has been bullish but not bulky increases the importance of onchain analysis and lower support levels. We can consider $28,500 as a critical point for future price movements. This lower support level should be followed closely and a strategy should be established by evaluating possible scenarios.
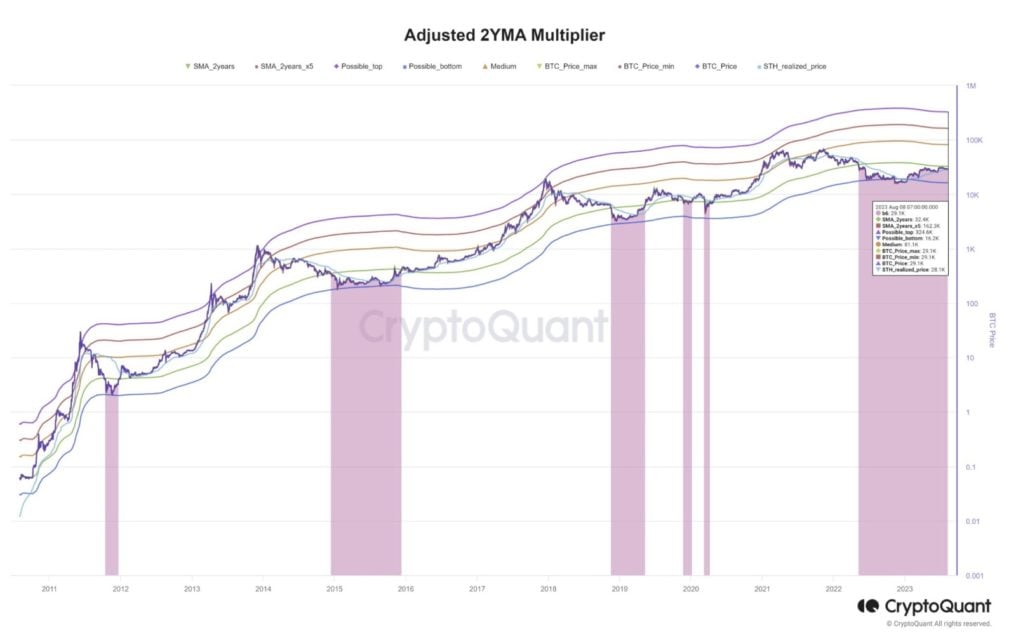
As for resistance, places to watch out for are the 2-year SMA resistance, 32.400K, which plays a critical role in a potential bullish scenario. If the price surpasses this resistance, it will clear the way for a move towards the targeted prices of $37,500 and $47,000.
https://glassnode.com/
https://www.lookintobitcoin.com/charts/golden-ratio-multiplier/
https://www.lookintobitcoin.com/charts/realized-price/
https://cryptoquant.com/


