Gold prices fell sharply after the above-expected US CPI figures. The Fed has been relatively calm with the speeches that the Fed’s hawk dose will be measured. The yellow metal found support around $1,700 in this environment. However, will $1,700 be a sustainable support level for gold? Gary Wagner, a technical analyst, seeks the answer to this question. We have prepared Wagner’s analyzes for our readers.
Sustainability of $1,700 from a historical perspective
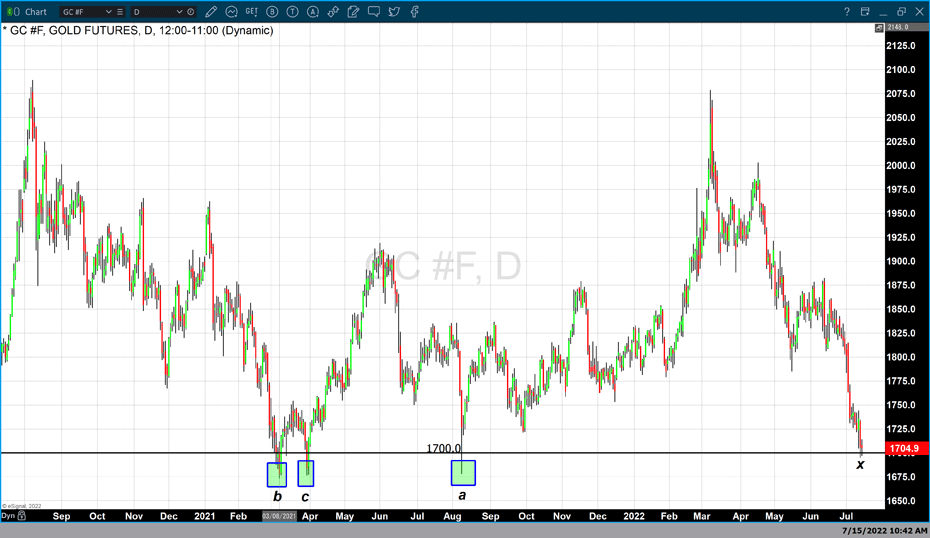
For two trading days, gold futures were trading below $1,700 (marked with an X). In both cases, it recovered the closing above this psychological level. So it’s not unreasonable to wonder if maintaining this price point is a possible support level or if there will be a pause before gold pushes prices down.

Historically speaking, gold’s most recent transaction below $1,700 occurred on August 9, 2021, the day of the ‘flash crash’. On Monday, August 9, 2021 (marked a) gold opened at $1,765. It traded at the low of $1,678 on the day. The yellow metal later closed at $1,726. In this example, $1,700 had little technical significance in this hundred-dollar trading range. Prior to that, gold traded below $1,700 twice in March 2021.
“Each time, gold found support at $1,680”
In both cases, gold fell as low as about $1,678. At the beginning of March 2021, gold (marked b) traded below $1,700 for three consecutive days before climbing above that price point. In the second instance, which occurred at the end of March (marked c), gold fell below 1,700. Then it opened below 1,700 the next day. But it closed well above that price point.

It is possible for historical studies to reveal many aspects. It is also likely to identify technical support and resistance levels. However, each identified sample resulted from underlying events based on a unique set of factors. It is therefore possible to give only a partial idea. Moreover, in every instance in the past two years where gold has traded below $1,700, it has led to much lower prices before trading above that price point. In fact, in all three examples highlighted on the chart, the price drop caused gold to quickly drop below $1,700 and see around $1,680 before finding support.
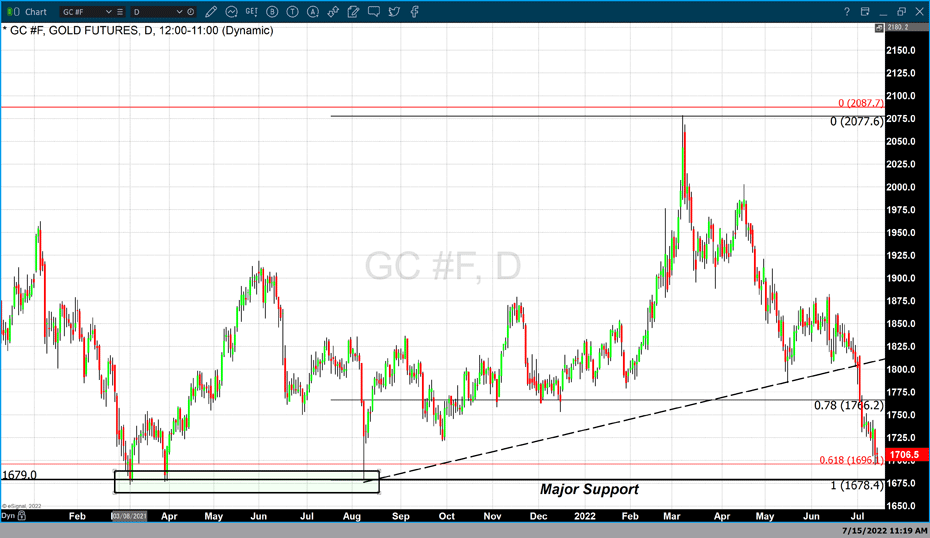
The chart above (chart 2) is also the daily gold futures chart. He refers to the same situations where gold fell below $1,700 three times. It does, however, highlight lows that indicate gold has crossed $1,700 each time and failed to find any price support until around $1,780. In each case, different fundamental events caused the gold price to drop. However, each time gold found support at $1,680, technically or otherwise.
“This fact can definitely drive the gold price down further”
By EDT gold futures, the most active August contract is currently up 0.04%. The price remained at $1,706.50. cryptocoin.com As you follow on Friday, gold hit below $1,700. It effectively closed above that price point. However, if past studies yield any real insights, gold prices are more likely not to stay at $1,700 based on technical indicators alone.

There must have been a fundamental event that resulted in a dynamic pivot or shift in the current bearish market sentiment prevailing underneath. The latest CPI and PPI report released this week shows that inflationary pressures have increased and persisted since last month. Also, the possibility that the Fed will raise a full percentage point at this month’s FOMC meeting is real. It is possible that this fact will certainly undermine it even further.


