XRP Sees Positive Spot Inflows Amid Market Dynamics
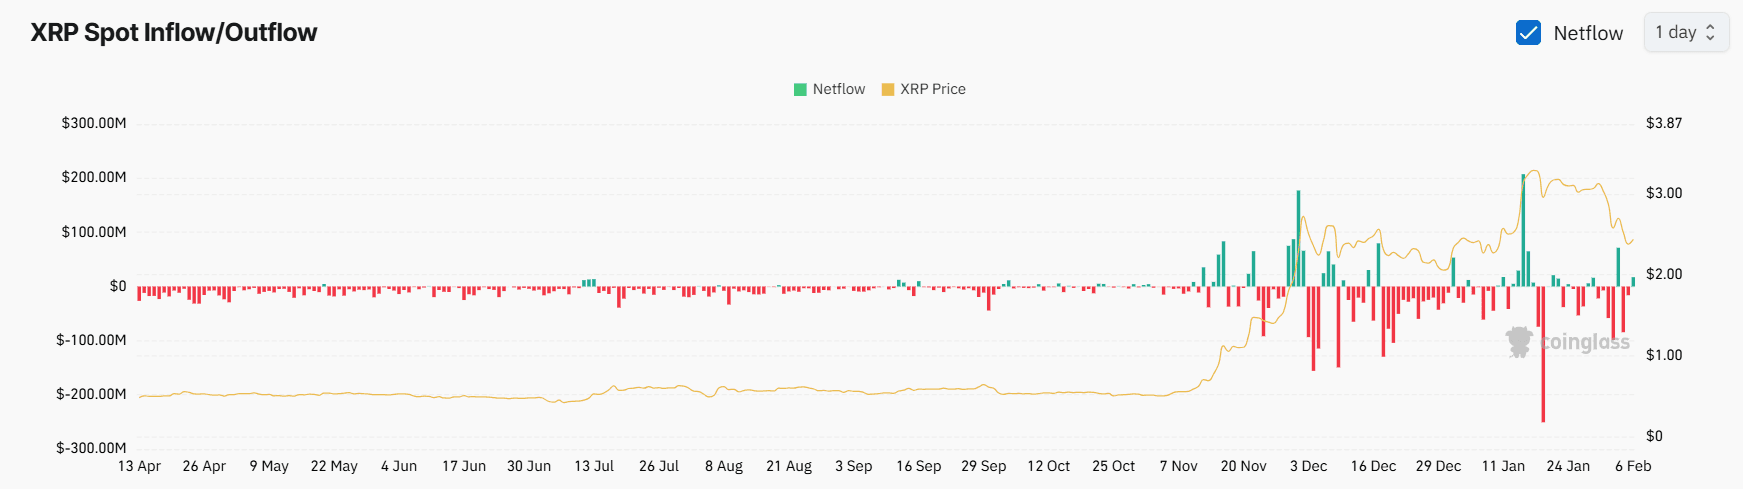
Early Thursday marked a notable shift for XRP, as net inflows to spot XRP tokens turned positive after several days of outflows. This development has brought the token back into the spotlight, particularly following an impressive month for its native decentralized exchange (DEX). According to data from Coinglass, more than $15 million in XRP was funneled into centralized exchanges, primarily driven by deposits to platforms like Bybit and Kraken. Such spot inflows often suggest an intention among traders to sell tokens on the open market, which could potentially undermine the prospects of a price rally.
Compounding the market’s cautious sentiment, the 8-hour funding rates in the XRP perpetual futures markets were recorded at -0.0065% as of Thursday morning. This figure indicates a prevailing bias toward short positions, which profit from price declines. Interestingly, XRP’s funding rates were more negative compared to those of major cryptocurrencies like ETH and BTC. Negative funding rates imply that traders holding short positions are willing to pay a fee to those with long positions in order to maintain their bearish strategies.
XRP’s Technical Indicators and Market Outlook
From a technical perspective, XRP is currently trading below several crucial moving averages. The 10-day exponential moving average (EMA) stands at $2.84, while the 21-day EMA is at $2.88. Trading below these averages signals a bearish outlook in the short term. However, it’s worth noting that the 100-day simple moving average (SMA) is situated just above $2, and the 200-day SMA is at $1.30, both of which are below the current price, indicating a bullish trend over the longer term. Moving averages are essential tools for identifying market trends by smoothing out price fluctuations, and the periods mentioned are commonly used by retail traders.
In terms of immediate resistance levels, XRP faces challenges at $2.49, followed closely by the $2.60 mark. A breakthrough past these levels could reignite bullish sentiment, paving the way for a potential rise toward the $3 threshold, which was breached in January for the first time since 2018.
Additionally, XRP’s 14-day relative strength index (RSI), which gauges the magnitude of price changes, was slightly above 36 during Asian trading hours, placing it firmly in the neutral zone. Traditionally, an RSI value exceeding 70 indicates overbought conditions, while values below 30 suggest oversold conditions. An RSI reading around 50 is generally considered neutral.